
Topic
Animated data visualization templates
Animated charts that build themselves: bars, lines, donuts, pies, maps and rankings, for explainers and reports.
From a single big number to a bar chart race or a world map colored by value, these templates turn data into motion for explainers, reports and social posts.
Free and Pro templates below. Open one, make it yours and export an MP4 for social, a transparent MOV or WebM for your editor, or a PNG. Free templates need no card (a free account after 3 exports); Pro templates are marked PRO.
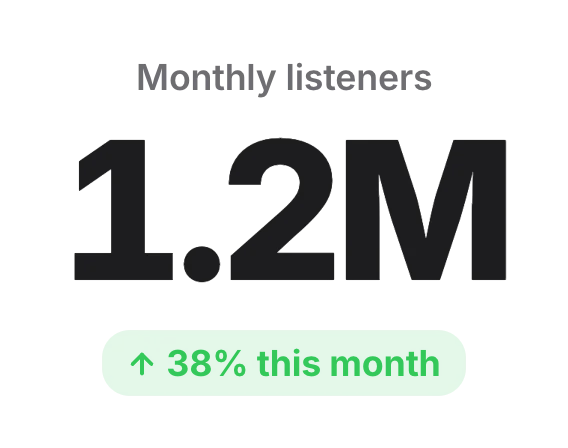 Stat counterData & stats
 Top 5 countdown listData & stats · transparent
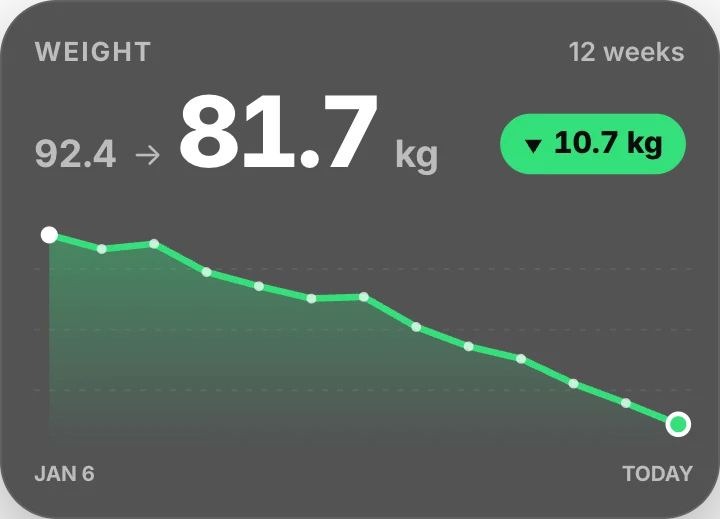 Weight progress chartFitness · transparent
 Obby game – Chat bubblesGaming · transparent
 Rising bubblesBuilding blocks · transparent
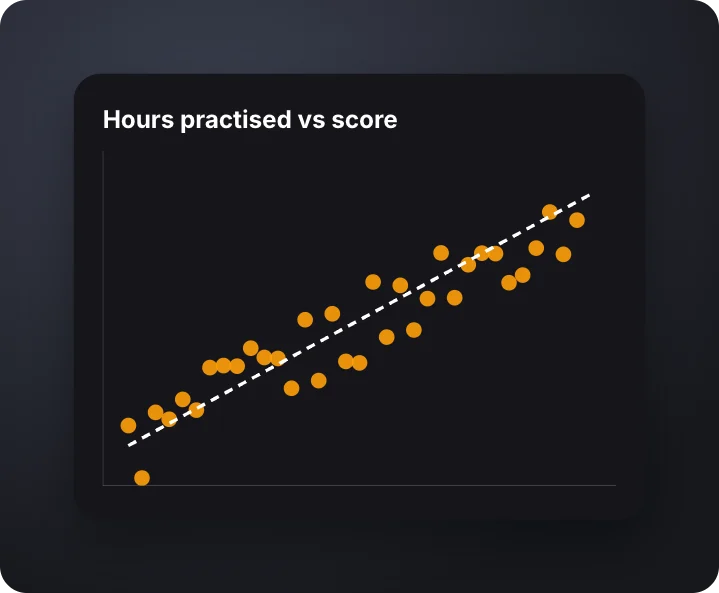 Scatter plotData & stats · transparent
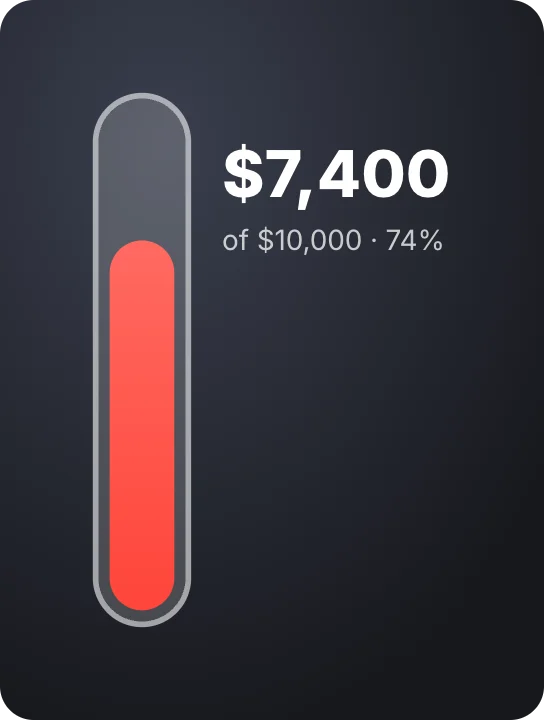 Goal thermometerData & stats · transparent
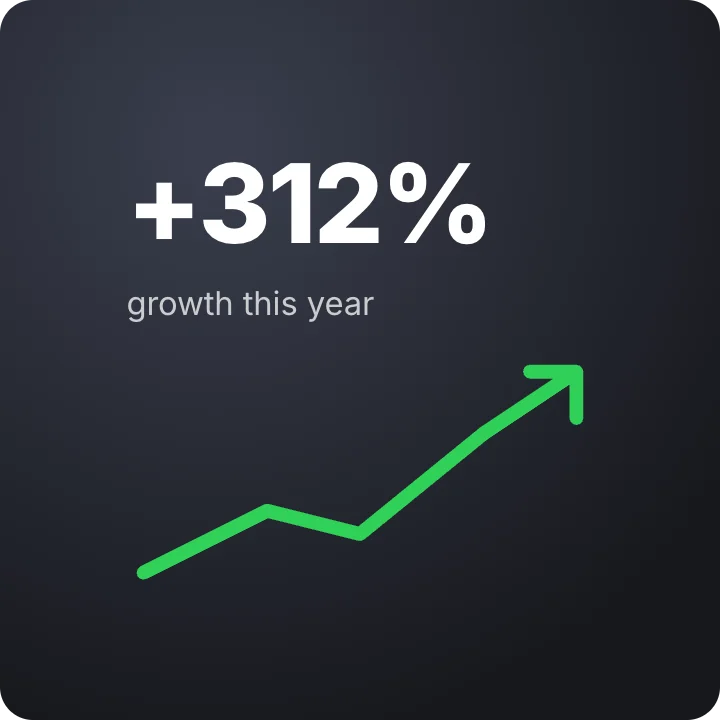 Growth arrowData & stats · transparent
 StopwatchData & stats · transparent
 Analog clockData & stats · transparent
 Loading spinnerData & stats · transparent
 Audio barsData & stats · transparent
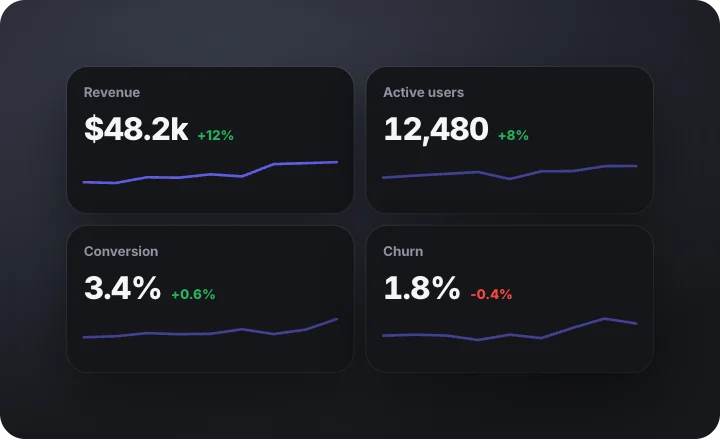 KPI tiles with sparklinesData & stats · transparent
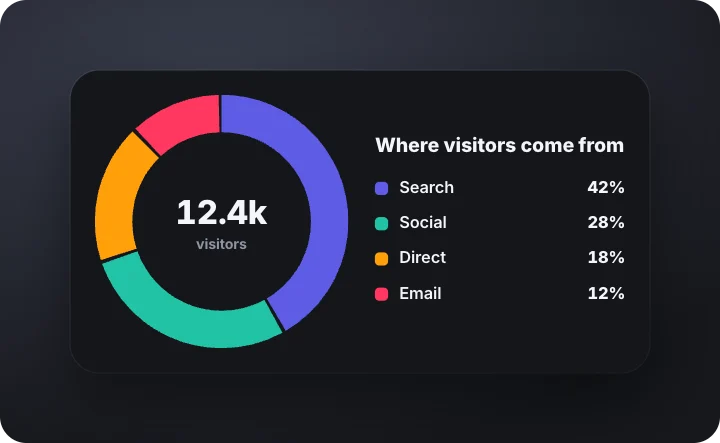 Donut chart with legendData & stats · transparent
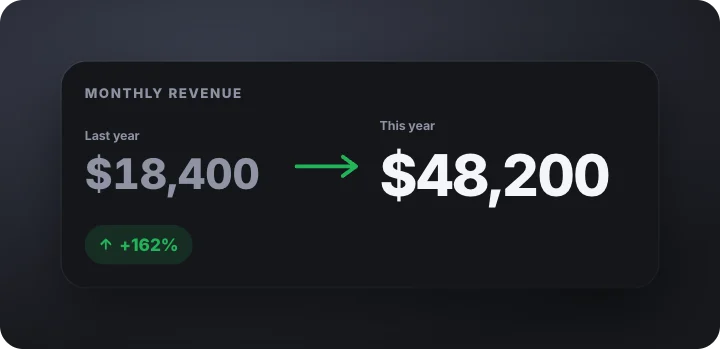 Before and after numberData & stats · transparent
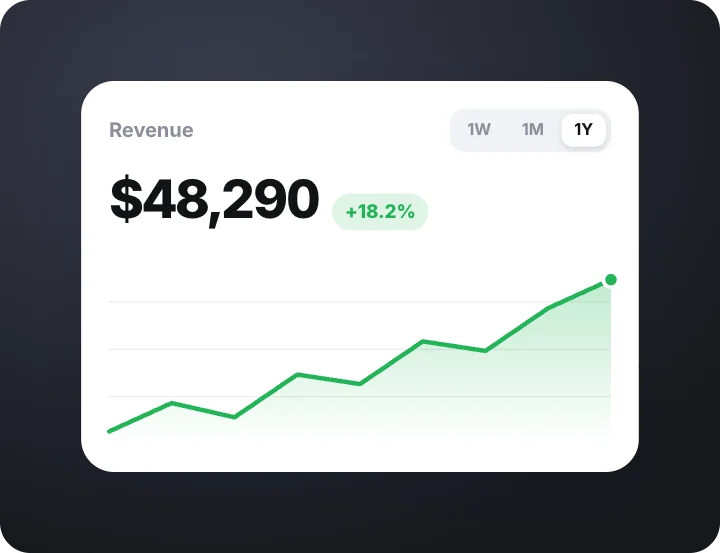 Revenue card with live chartProducts & apps · transparent
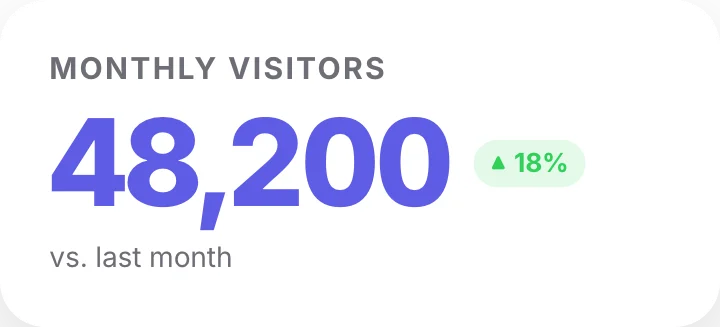 Statistic – basicData & stats
 CounterData & stats · transparent
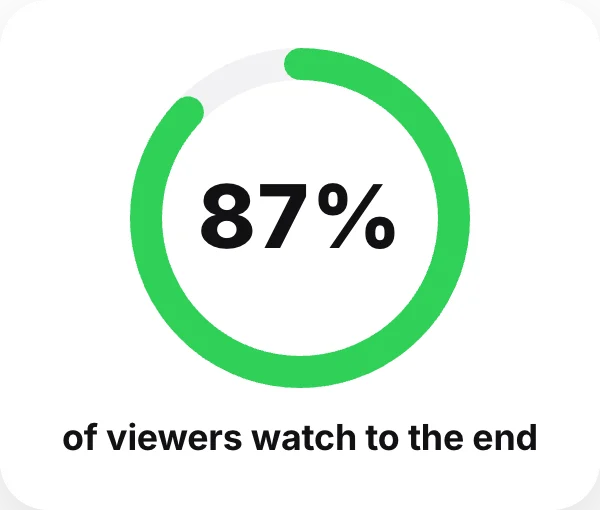 Percentage ringData & stats
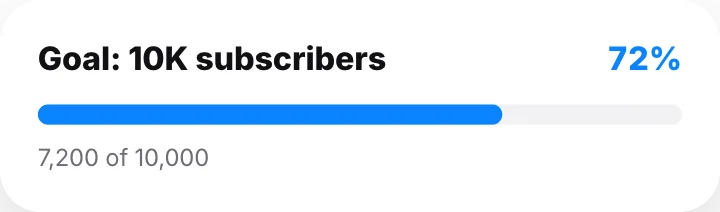 Progress barData & stats
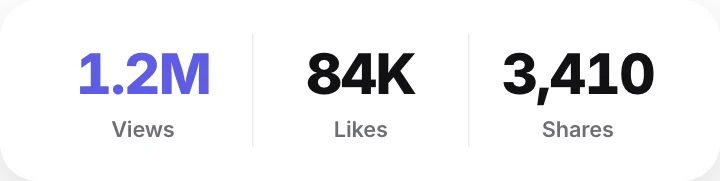 Stats rowData & stats
 Countdown timerData & stats · transparent
 Star ratingData & stats
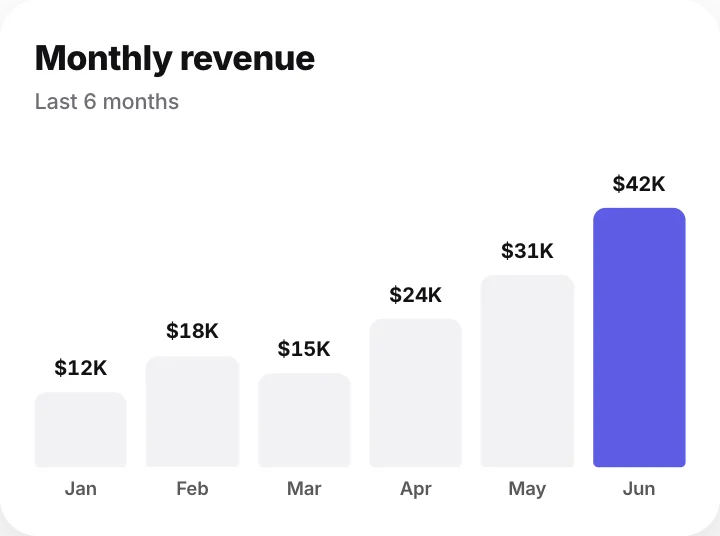 Bar chartData & stats
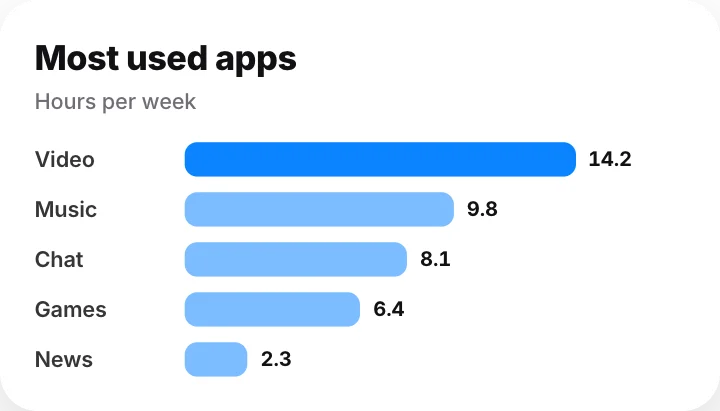 Horizontal bar chartData & stats
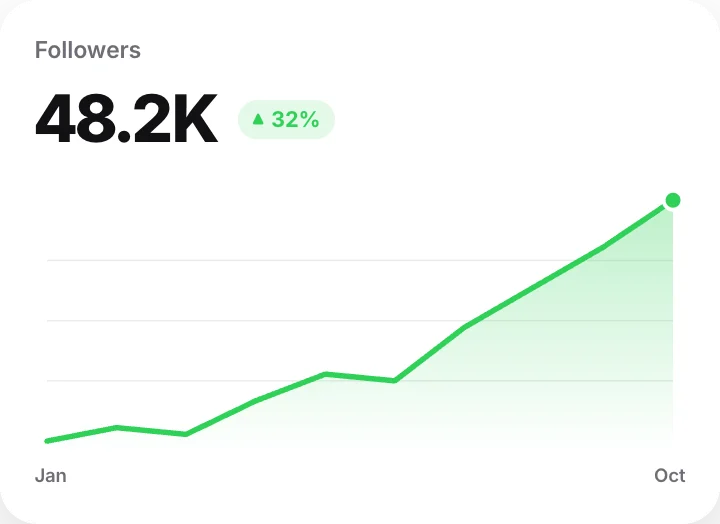 Line chart with totalData & stats
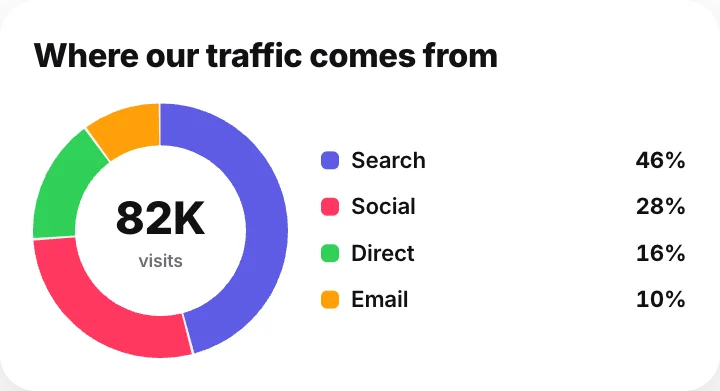 Donut chartData & stats
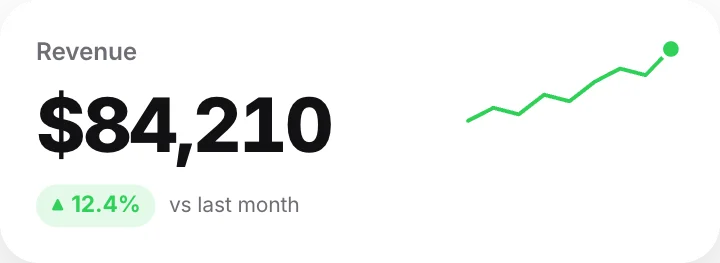 Stat with trend lineData & stats
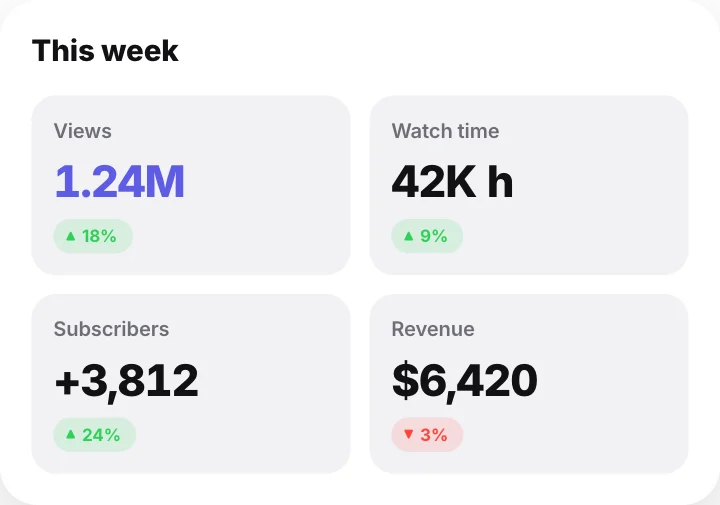 KPI gridData & stats
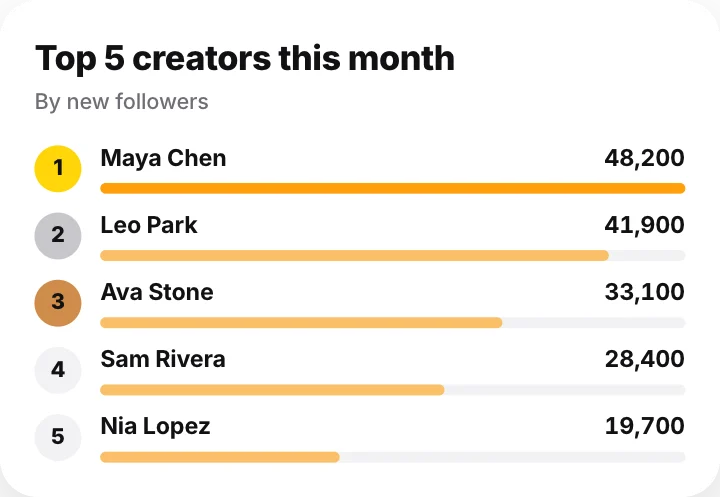 Top 5 rankingData & stats
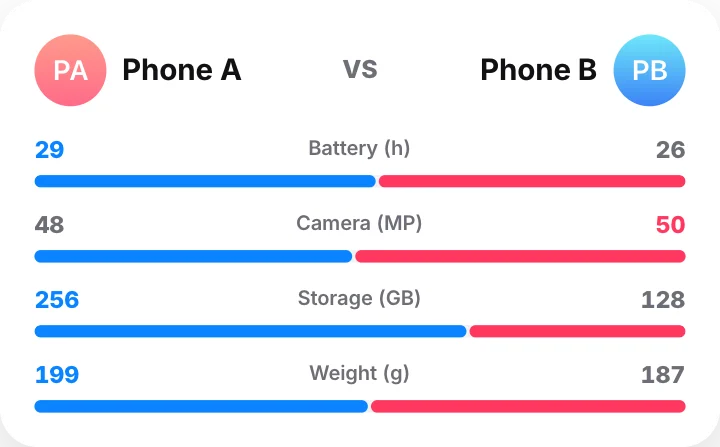 Versus statsData & stats
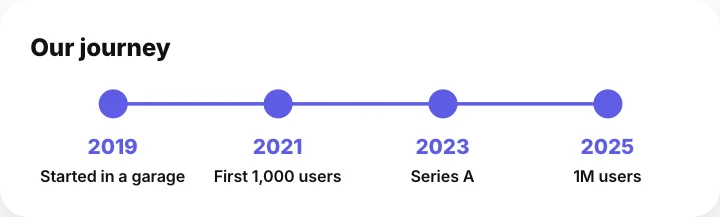 Timeline – horizontalData & stats
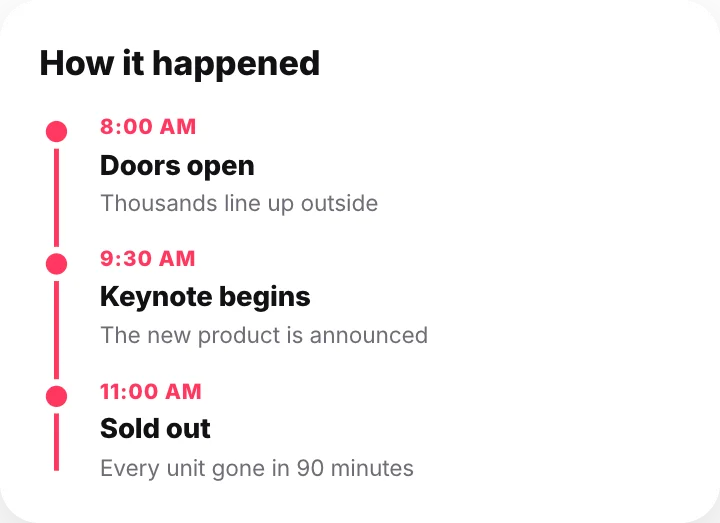 Timeline – verticalData & stats
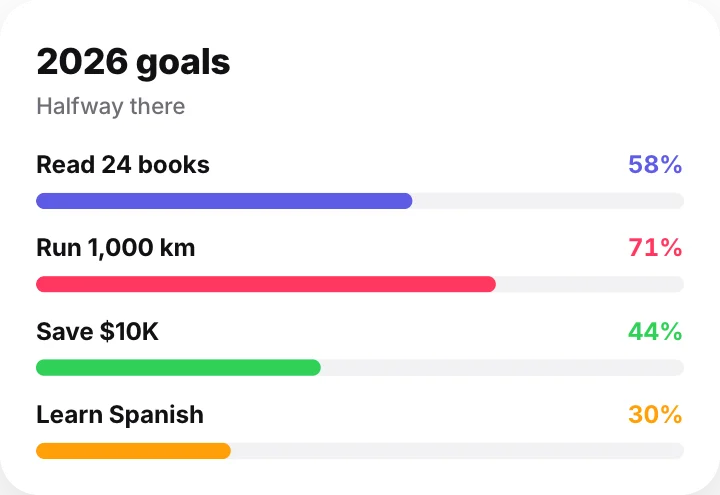 Progress bars – multipleData & stats
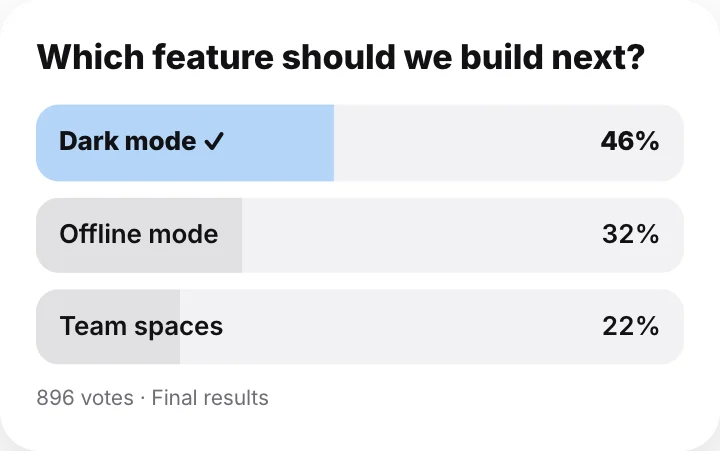 Poll resultsData & stats
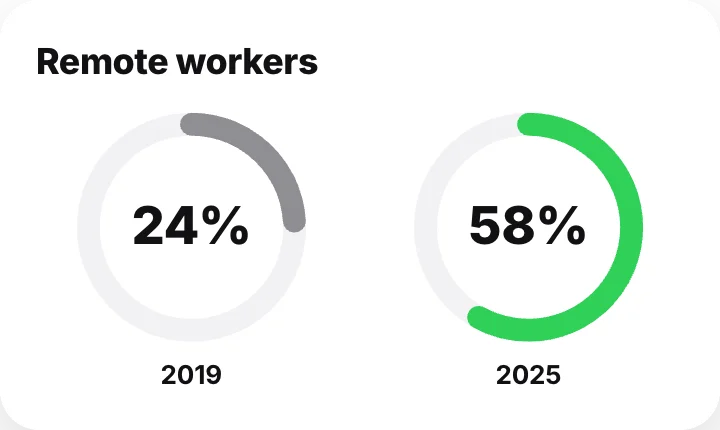 Percentage comparisonData & stats
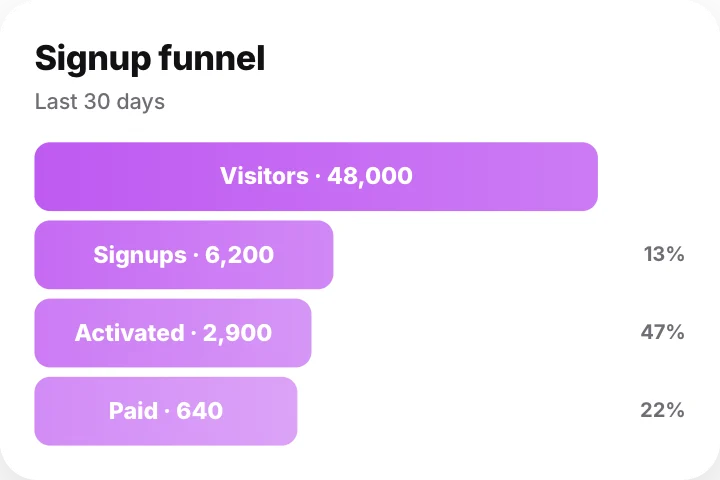 Funnel chartData & stats
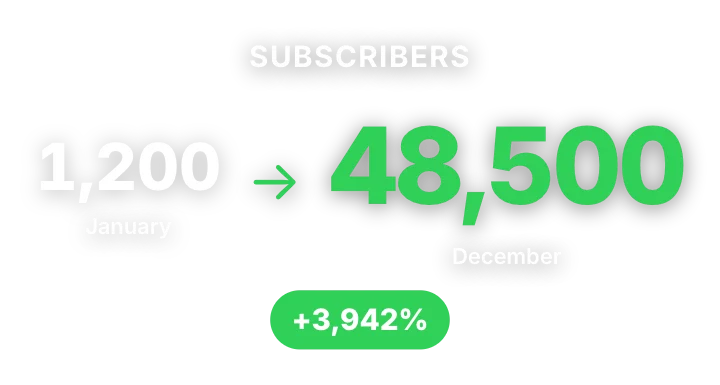 Growth counterData & stats · transparent
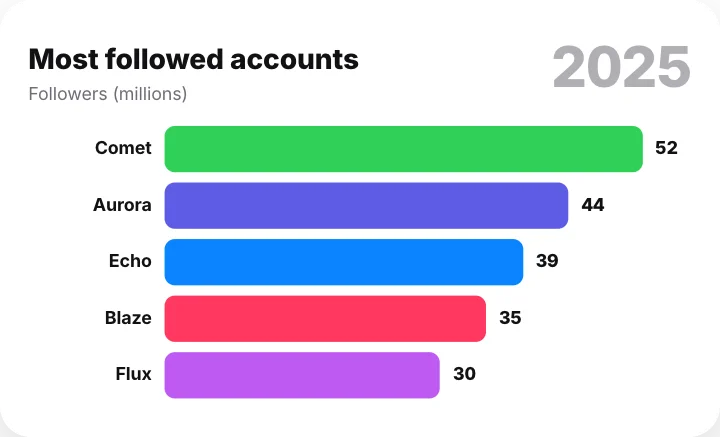 Bar chart raceData & stats
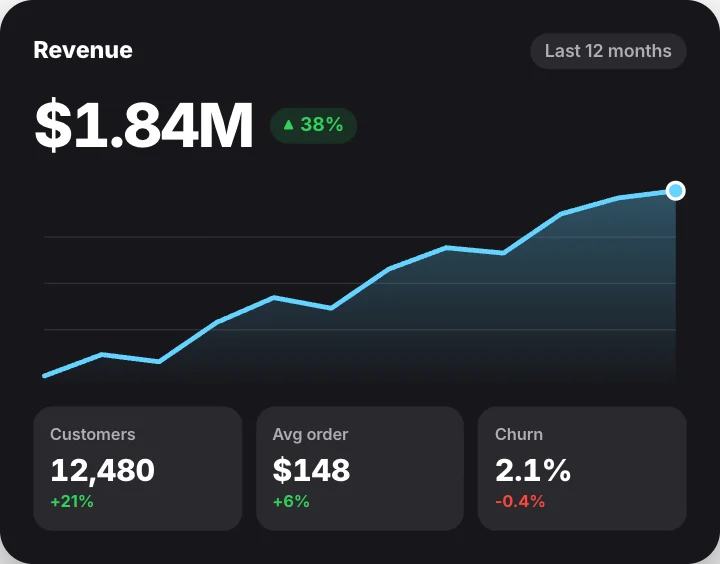 Analytics dashboardData & stats
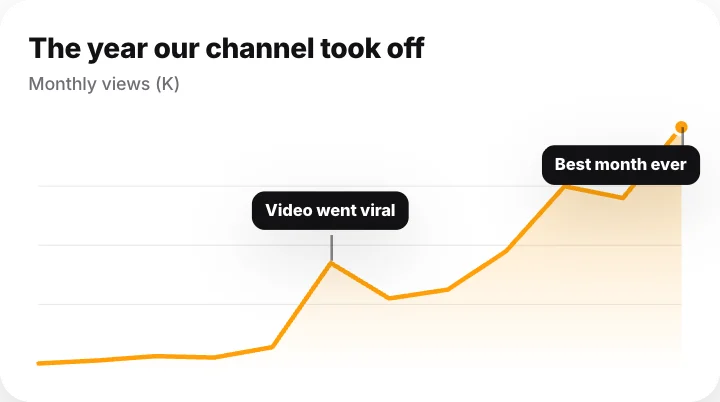 Annotated line chartData & stats
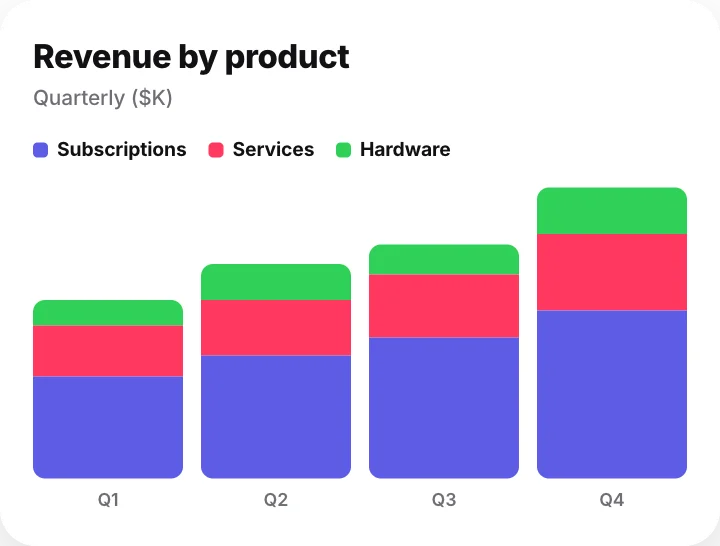 Stacked bar chartData & stats
 Comparison tableData & stats
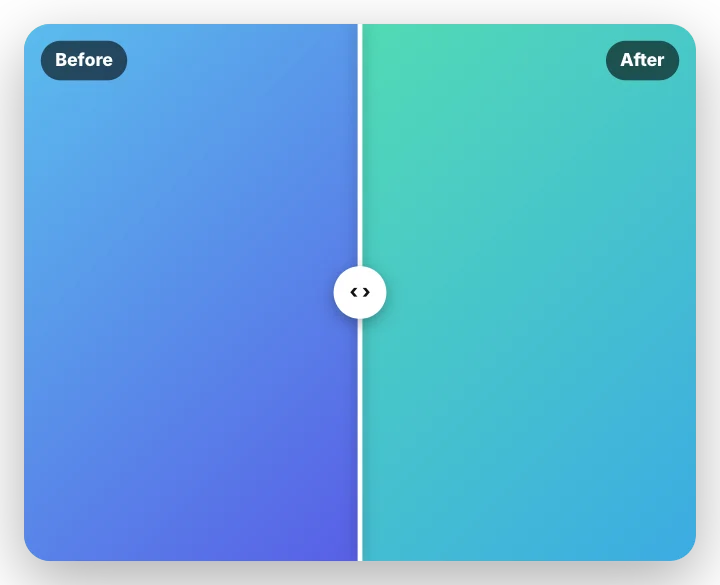 Before / after sliderData & stats · transparent
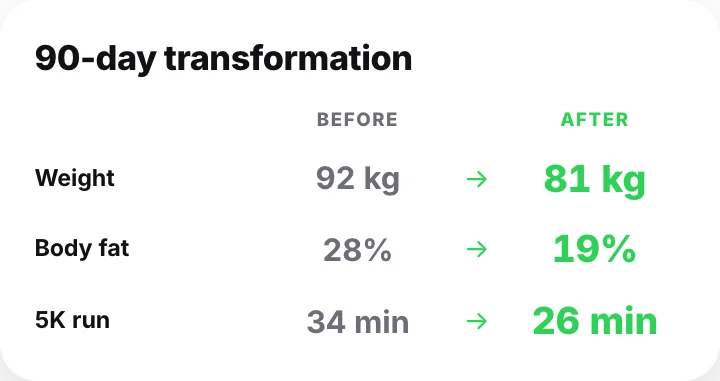 Before / after resultsData & stats
 Cinematic timelineData & stats · transparent
 RoadmapData & stats
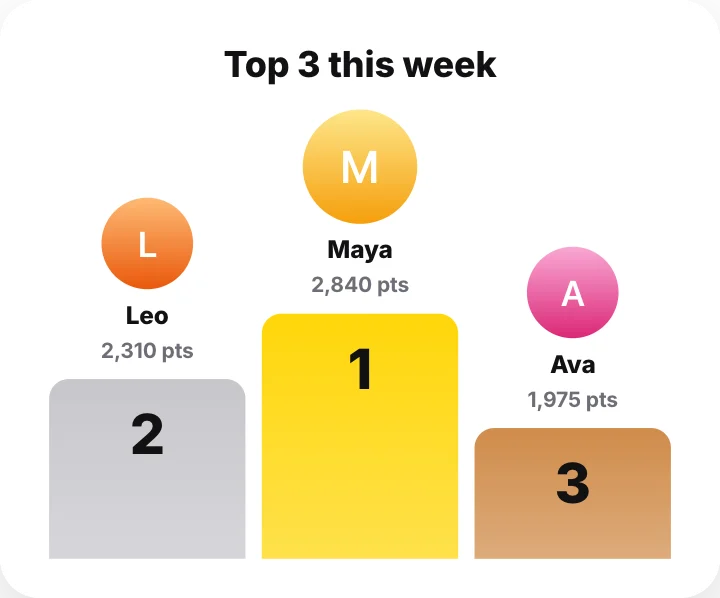 Podium – top 3Data & stats
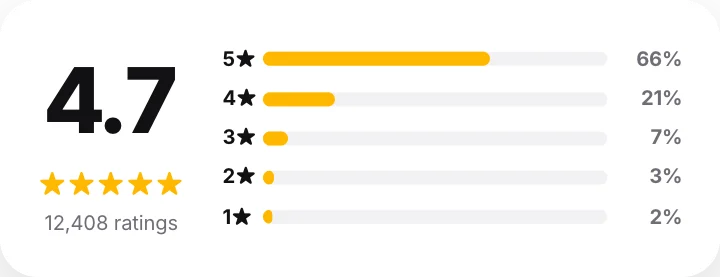 Rating breakdownData & stats
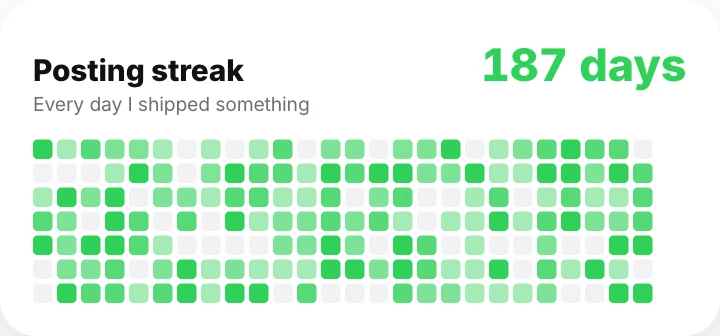 Streak calendarData & stats
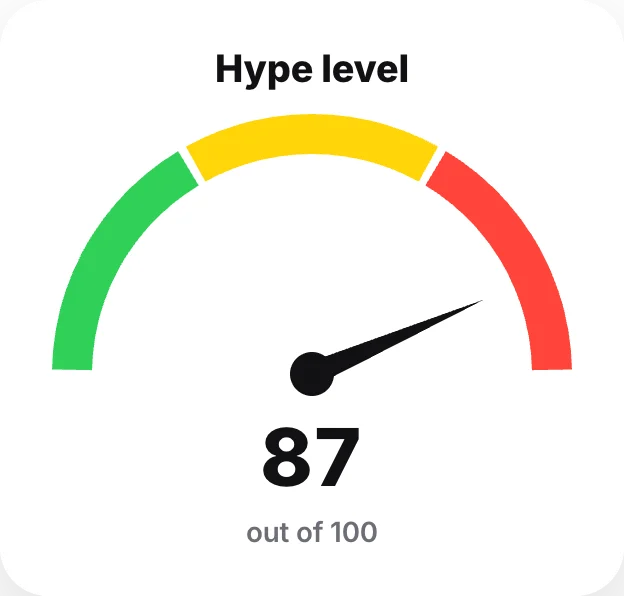 Gauge meterData & stats
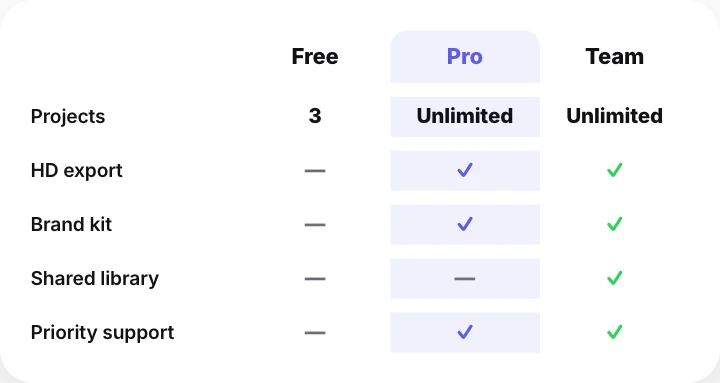 Feature comparison tableData & stats
 Pros and consData & stats
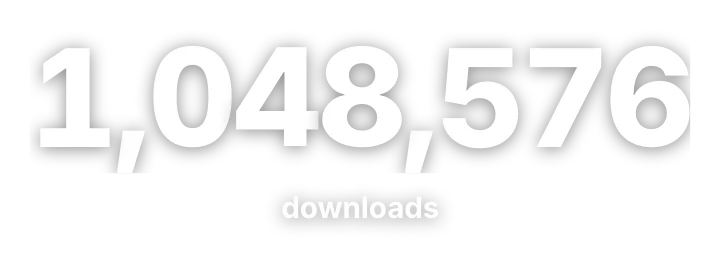 Rolling numberData & stats · transparent
 Stat storyData & stats · transparent
 Waffle chartData & stats
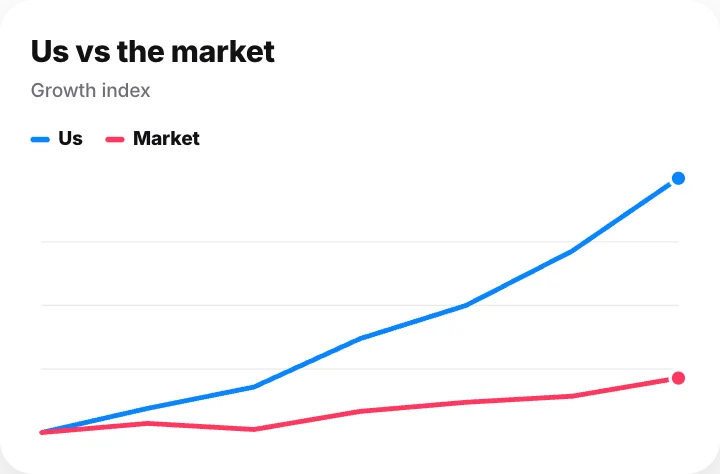 Two-line comparisonData & stats
 People pictogramData & stats
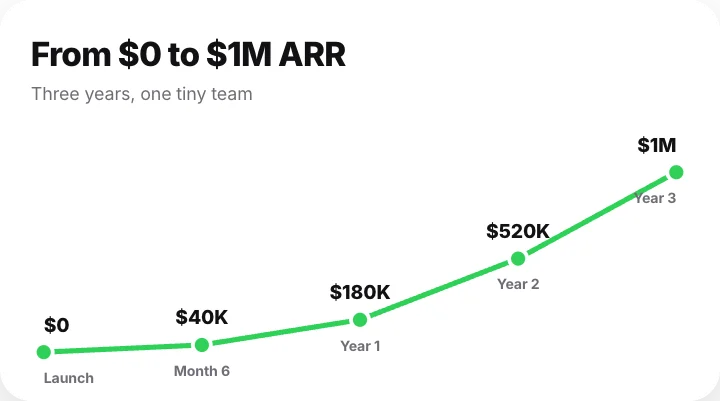 Growth story chartBusiness
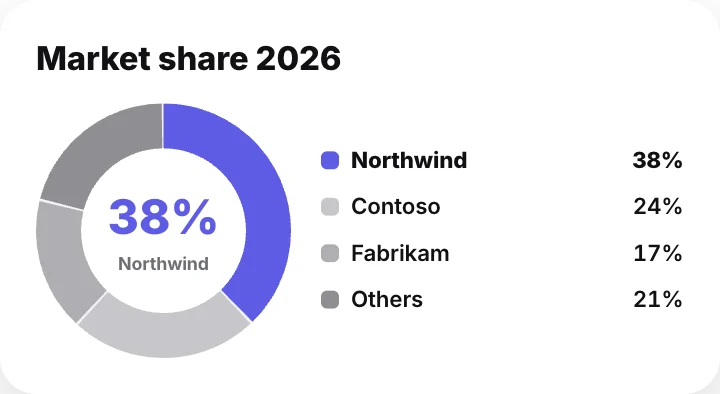 Market shareBusiness
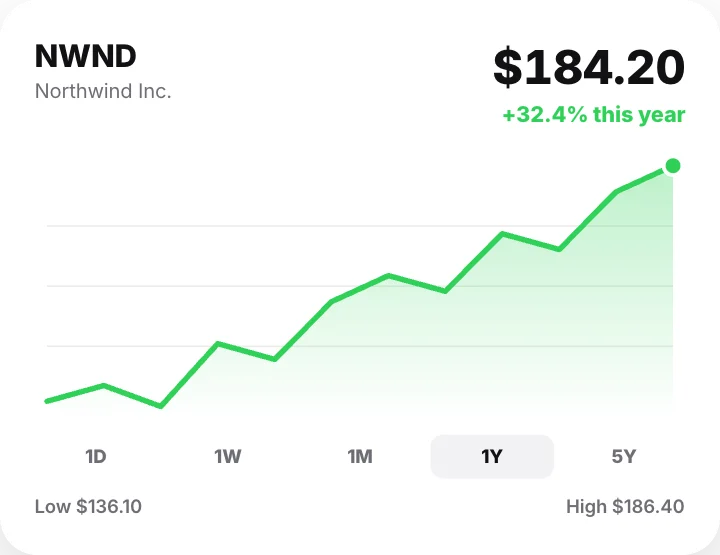 Stock price chartBusiness
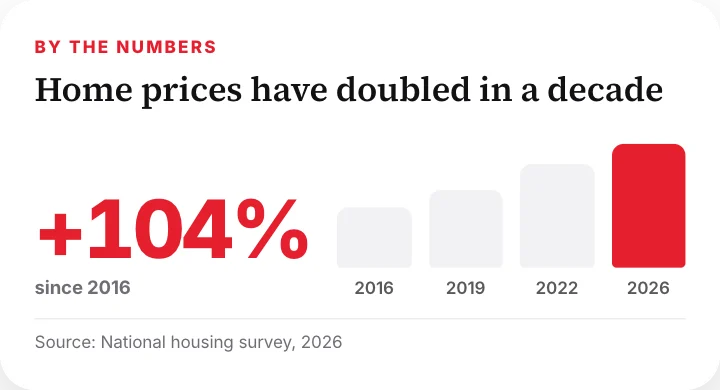 News by the numbersNews & docs
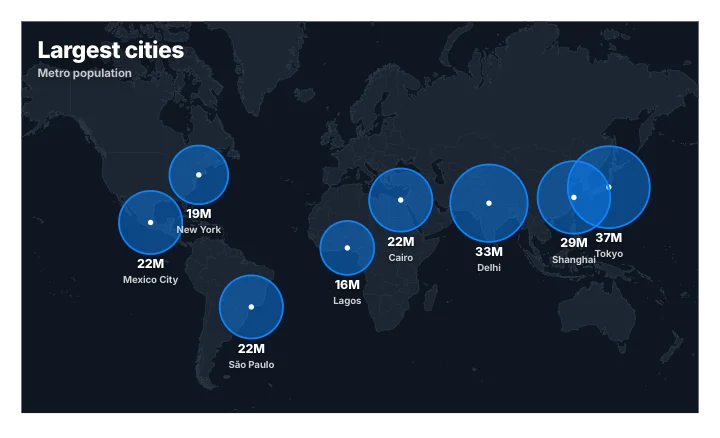 Map data bubblesTravel & maps · transparent
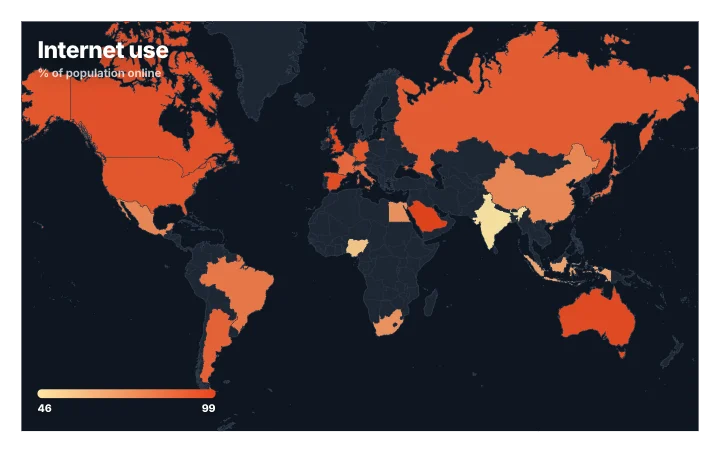 Country data mapTravel & maps · transparent
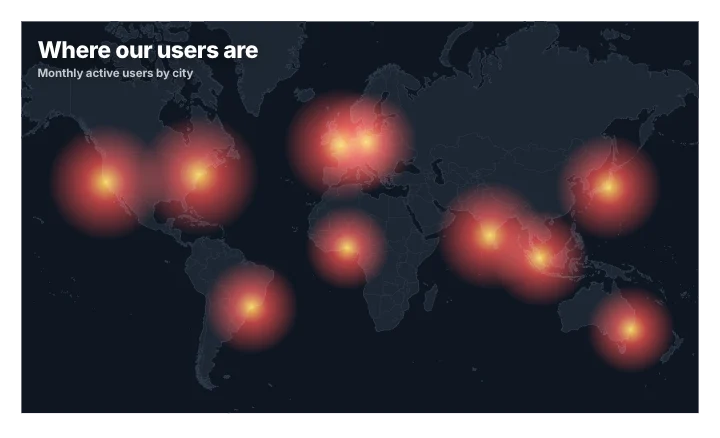 Heat mapTravel & maps · transparent
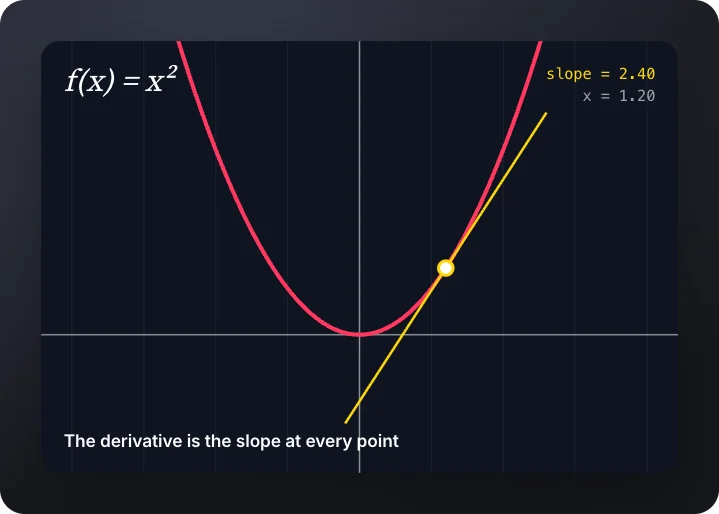 Function plotStudio
 Rising bubblesBackgrounds
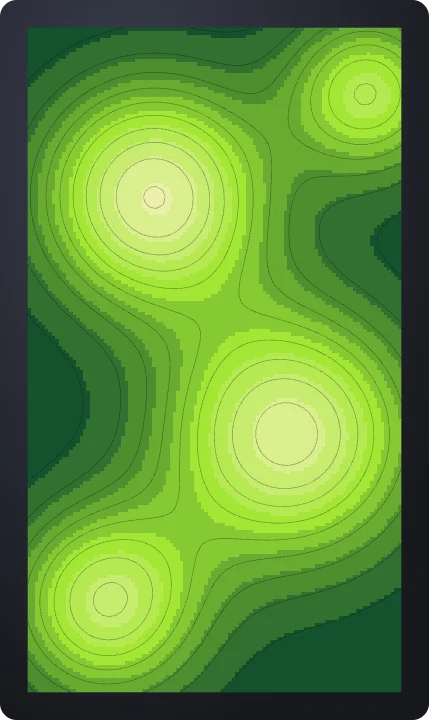 Filled terrainBackgrounds
 Graph paperBackgrounds
 Org chartBusiness
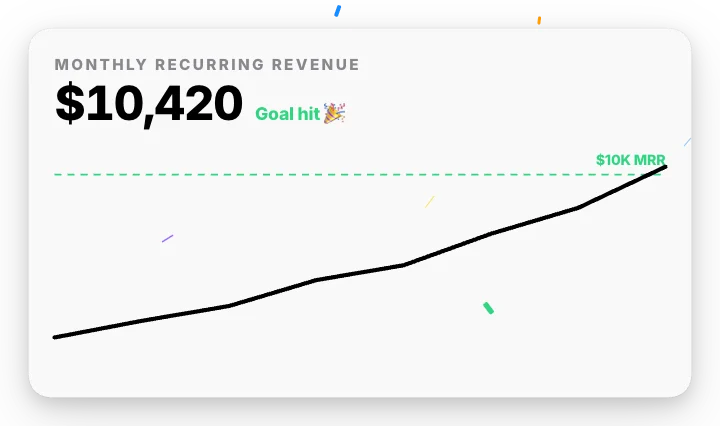 Revenue milestone chartBusiness
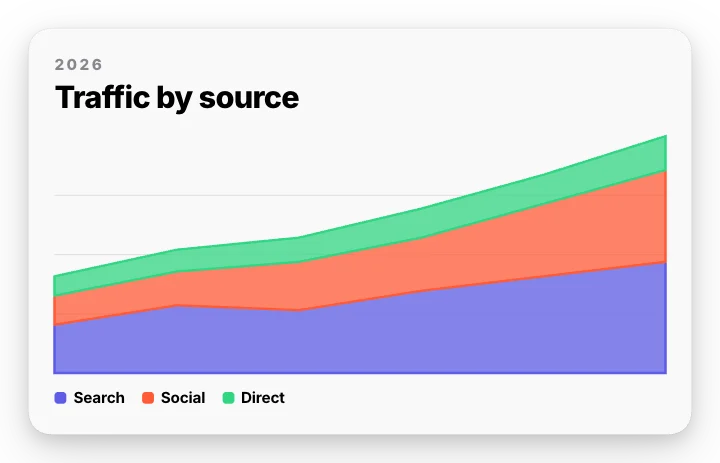 Stacked area chartData & stats
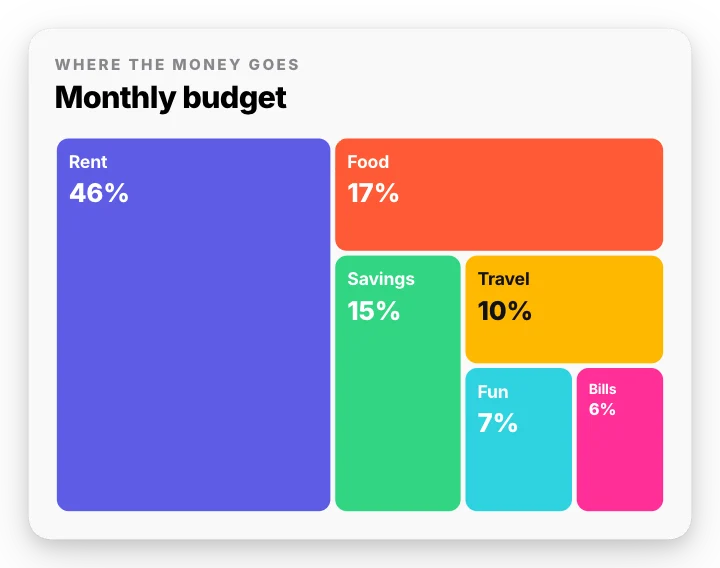 TreemapData & stats
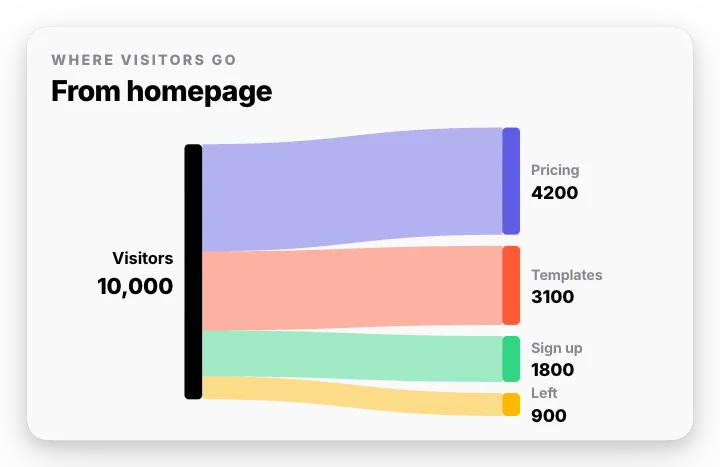 Sankey flow chartData & stats
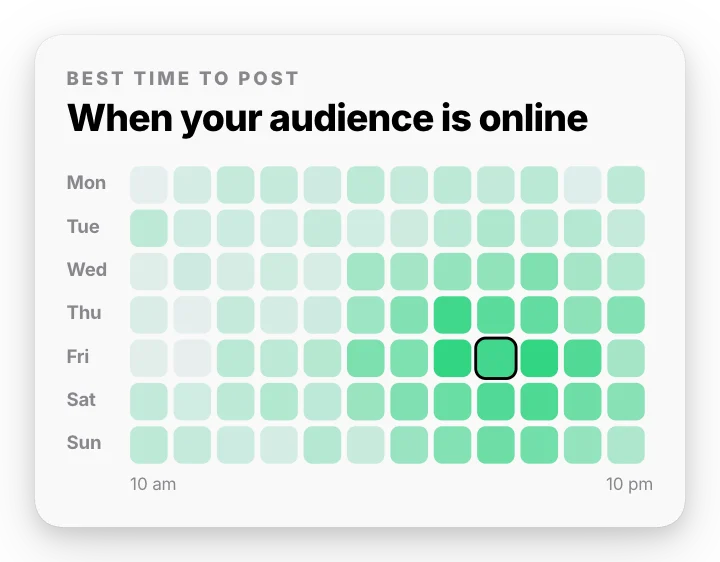 Best time to post heatmapData & stats
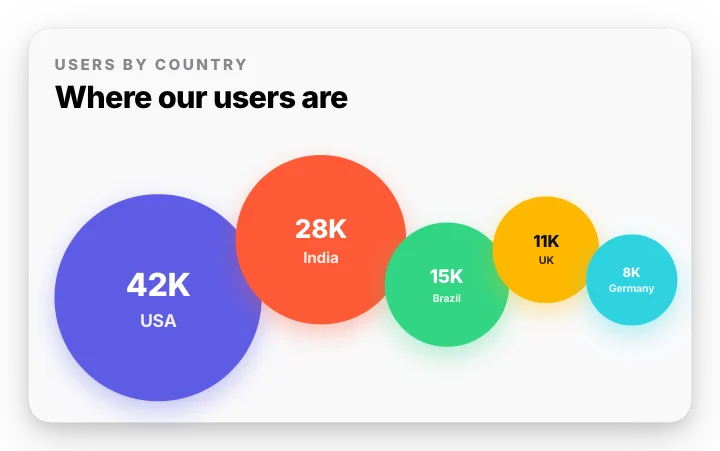 Bubble chartData & stats
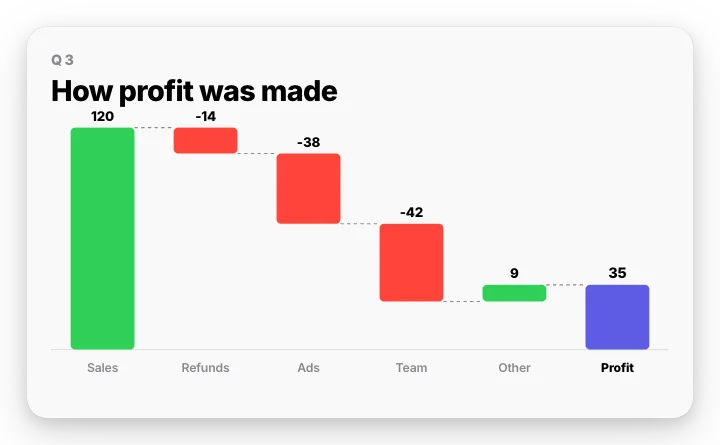 Waterfall chartData & stats
 Venn diagramData & stats
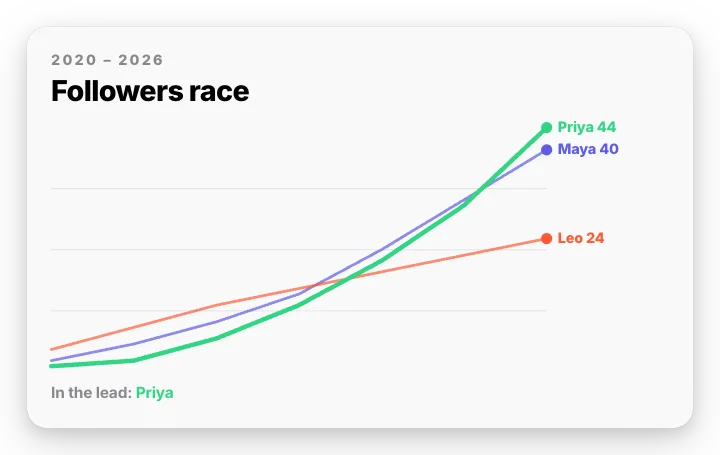 Line race chartData & stats
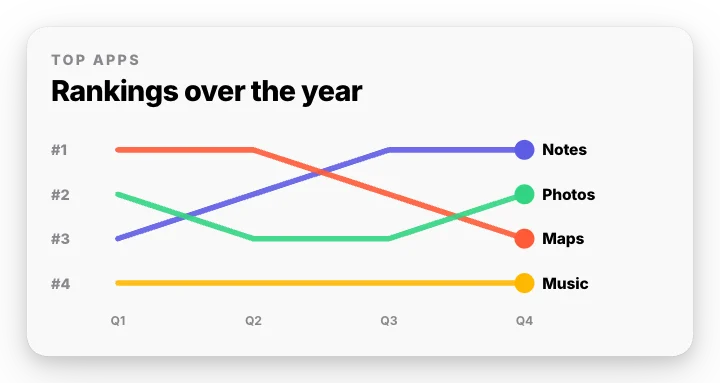 Ranking bump chartData & stats
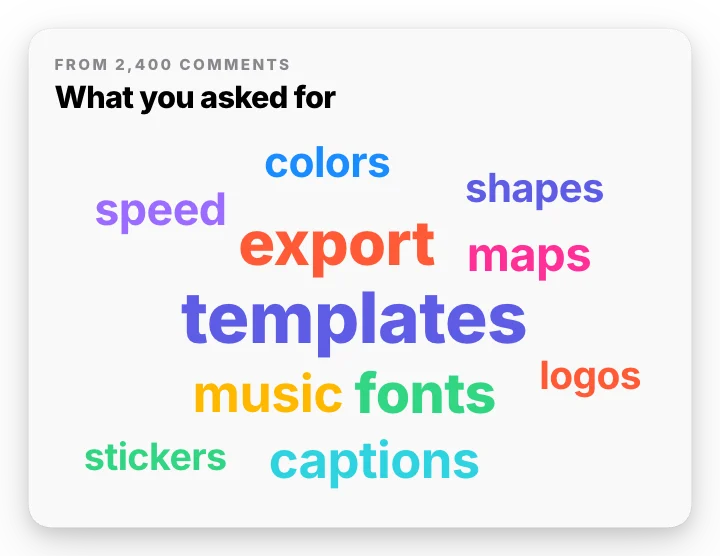 Word cloudData & stats
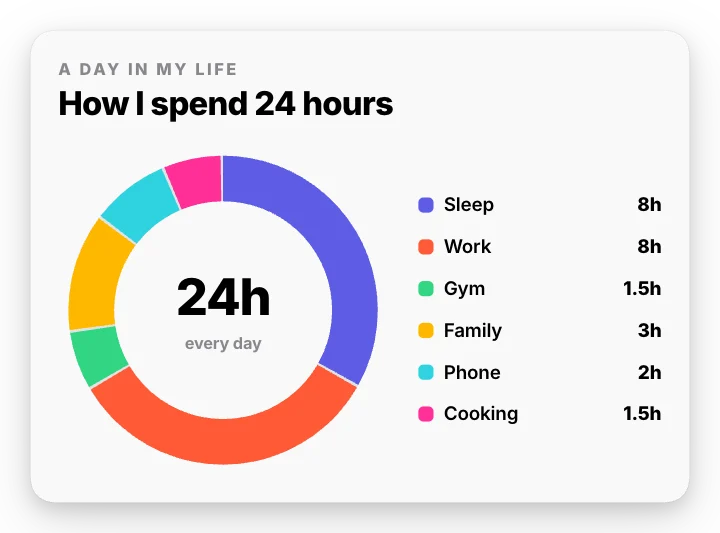 24-hour day ringData & stats
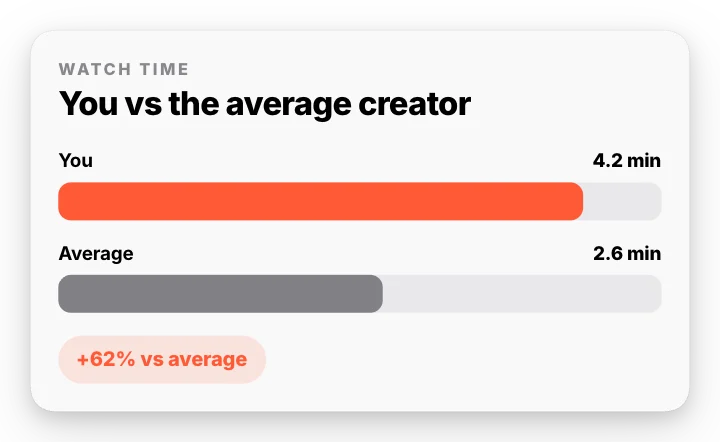 You vs averageData & stats
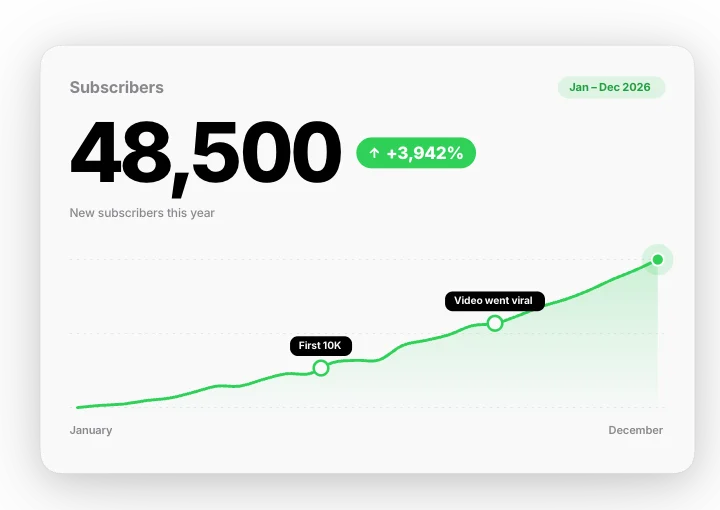 Number growth – count and chartMotion Clips
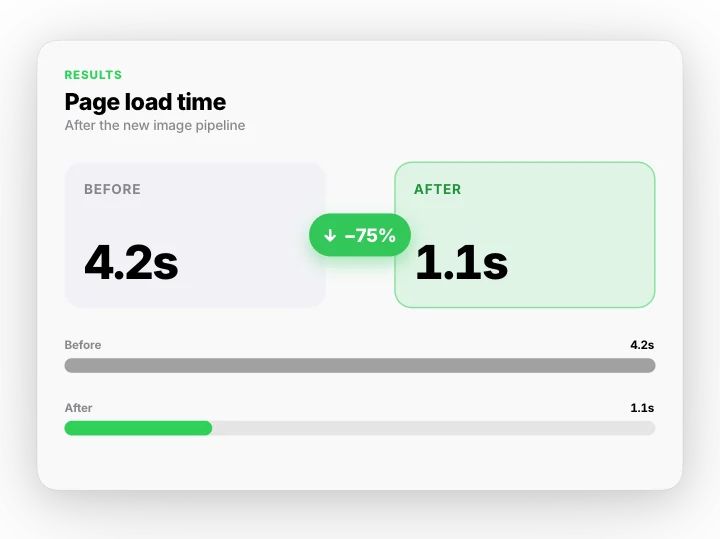 Before and after – the numbersMotion Clips
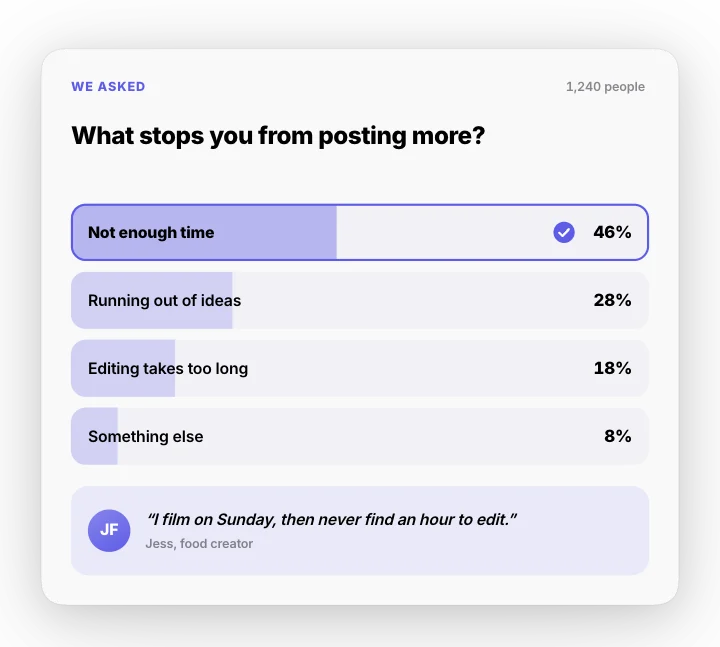 Survey results – bars and a quoteMotion Clips
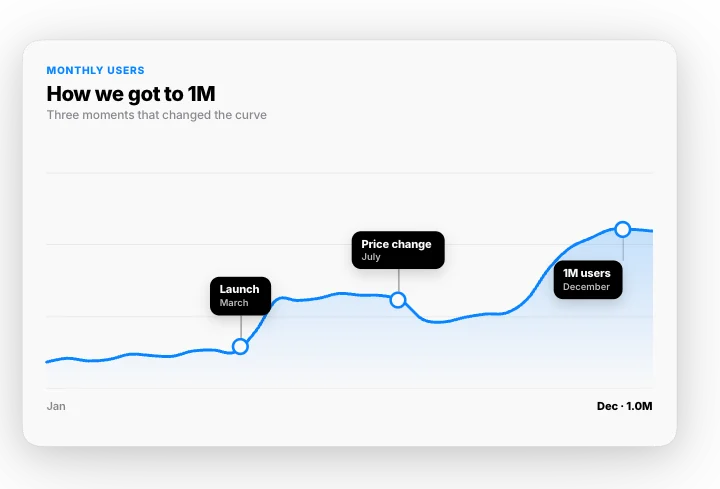 Annotated chart – the story of a lineMotion Clips
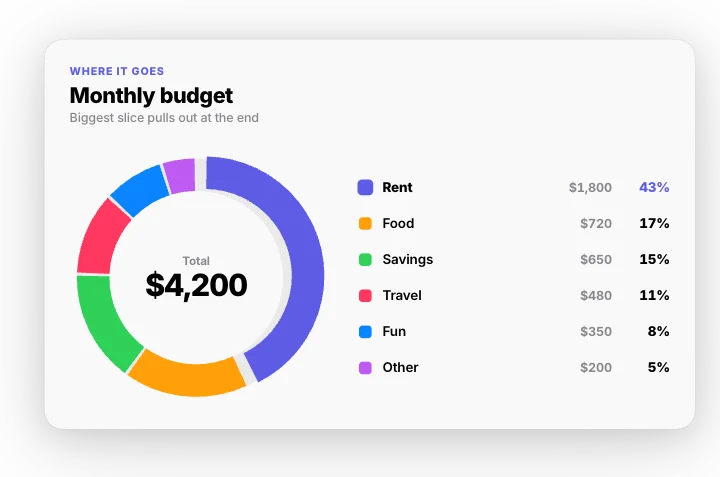 Budget donut – where it goesMotion Clips
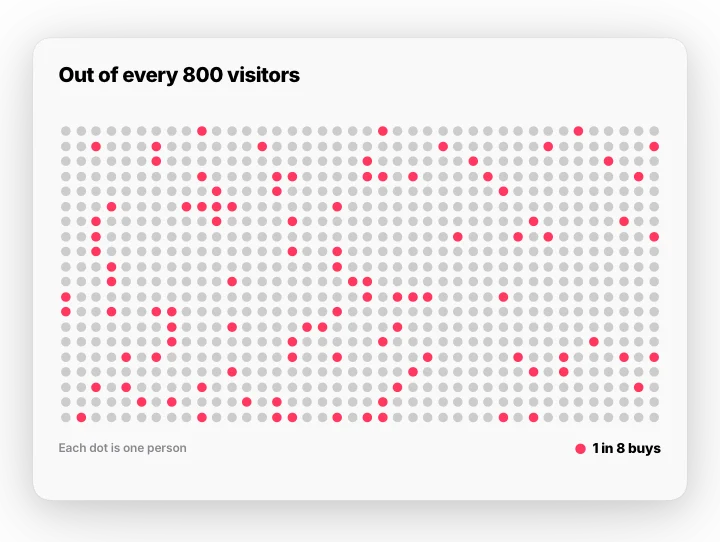 Scale zoom – one in manyMotion Clips
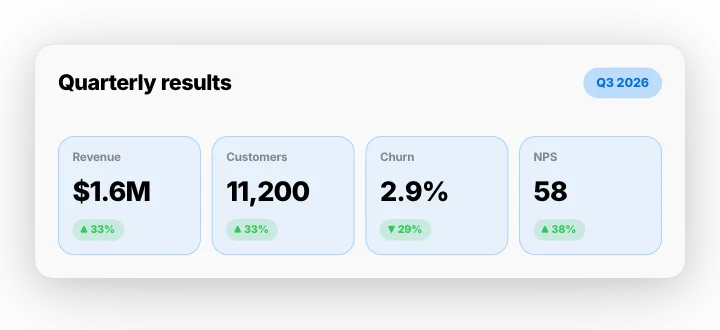 Quarter report – cards flip overMotion Clips
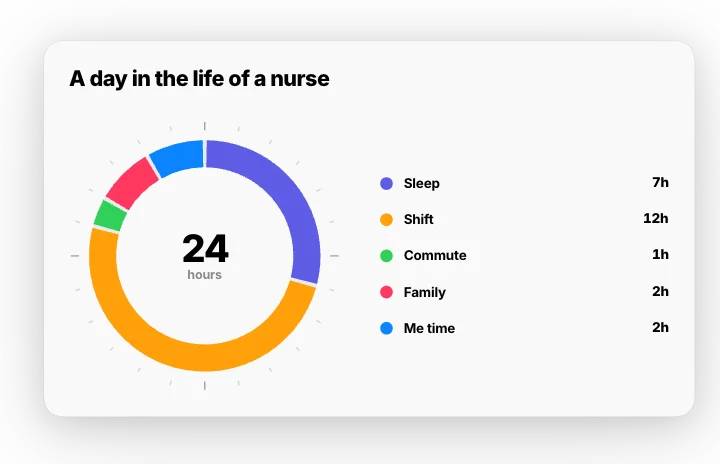 A day in hours – 24-hour ringMotion Clips
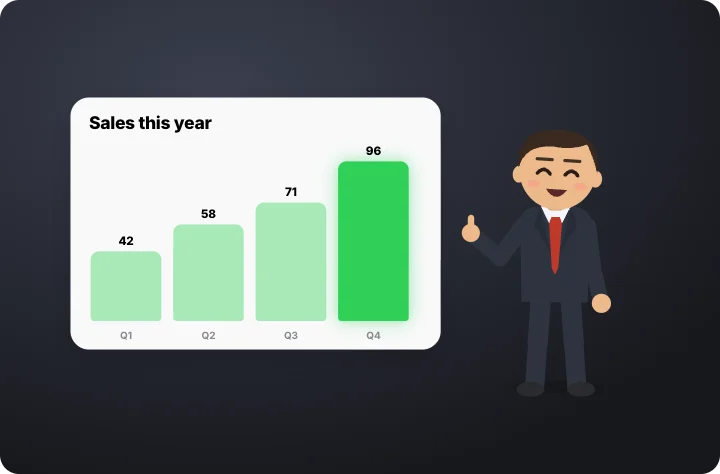 Character presents a chartMotion Clips · transparent
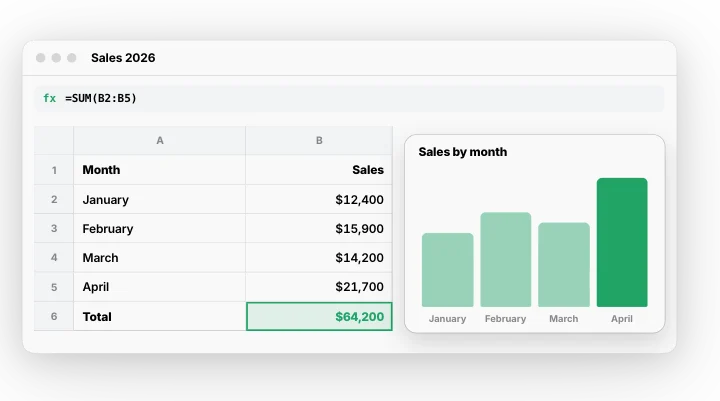 Spreadsheet – sum and chartMotion Clips
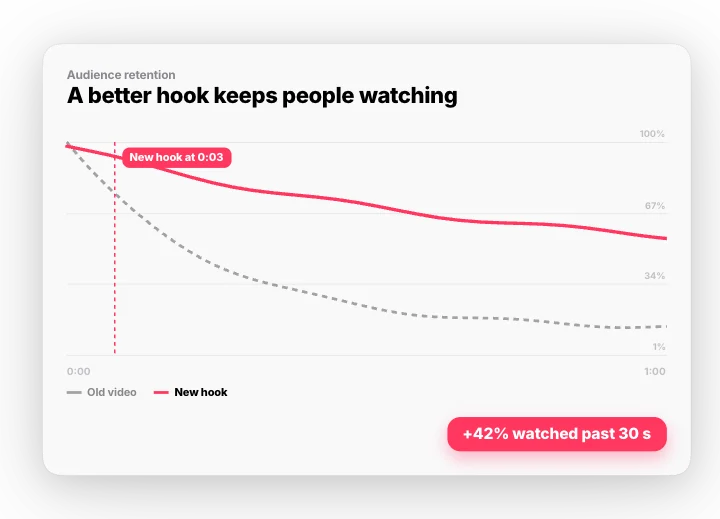 Audience retention – a better hookMotion Clips
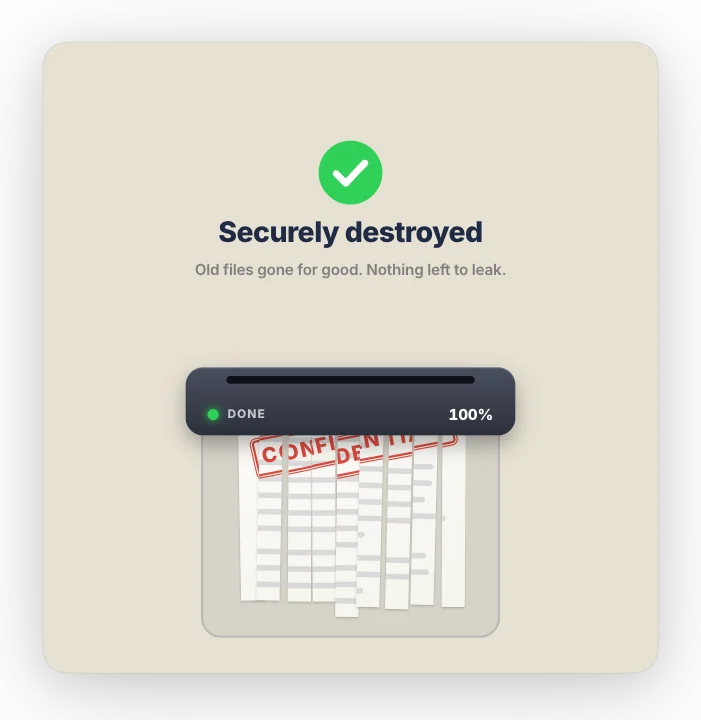 Paper shredder – securely destroyedMotion Clips
Guides and tools
How to make animated charts and a bar chart race videoTurn your numbers into animated bar charts, line graphs, donuts, rankings and bar chart races for YouTube, Reels and presentations, without Excel or After Effects.How to make an animated location mapDrop a pin on a real street map, show a delivery radius, build a store locator, zoom from the world to a street, or map data by country, all free and without an API key.What are motion graphics?Motion graphics are animated graphic design: text, shapes, charts, maps and icons that move. Here is what they are, where they are used, and how to make them.How to make animated social media graphicsMake animated graphics for TikTok, Instagram Reels, YouTube Shorts and YouTube: hooks, captions, comment replies, counters, end screens and overlays, with the right sizes and formats.Animated number counterCount up to any number with a label: followers, sales, downloads or percentages. Smooth easing, your colors, transparent background. Free, export MP4 or MOV.Animated chart makerMake animated bar charts, line graphs and donut charts that build themselves with numbers counting up. Free, no card, export MP4 or transparent MOV.Bar chart race makerCreate a bar chart race where bars overtake each other as the numbers change, like the popular "most followed" ranking videos. Runs in your browser.