
Free and Pro templates
Animated chart maker
An animated chart maker for videos: animated charts and graphs that draw themselves. Bar charts, line graphs, donut and pie charts, bar chart races, rankings, timelines, funnels, KPI grids and before-and-after comparisons that build themselves on screen, with every number counting up.
Type your labels and values and the chart animates to match. Use them for explainers, YouTube essays, business updates, school projects and "the numbers behind" videos, then export MP4 or a transparent MOV to lay over footage.
All data & stats templates
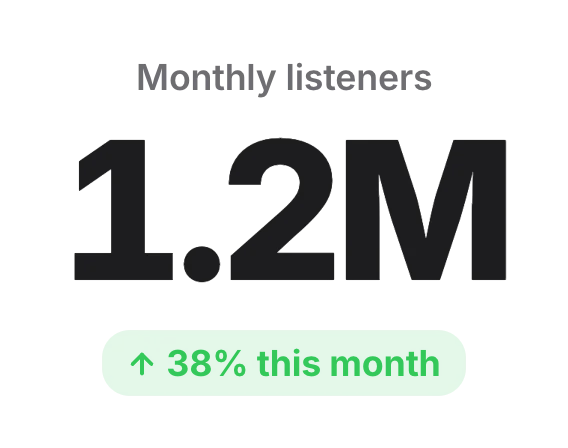 Stat counterData & stats
 Top 5 countdown listData & stats · transparent
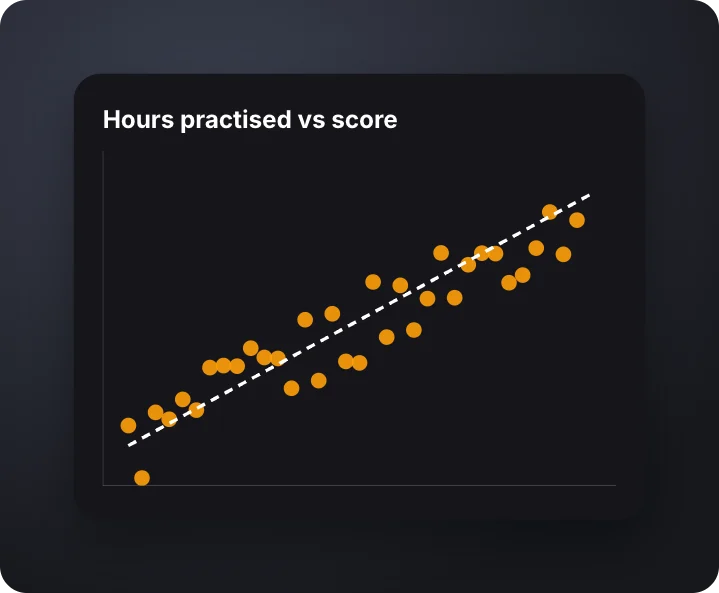 Scatter plotData & stats · transparent
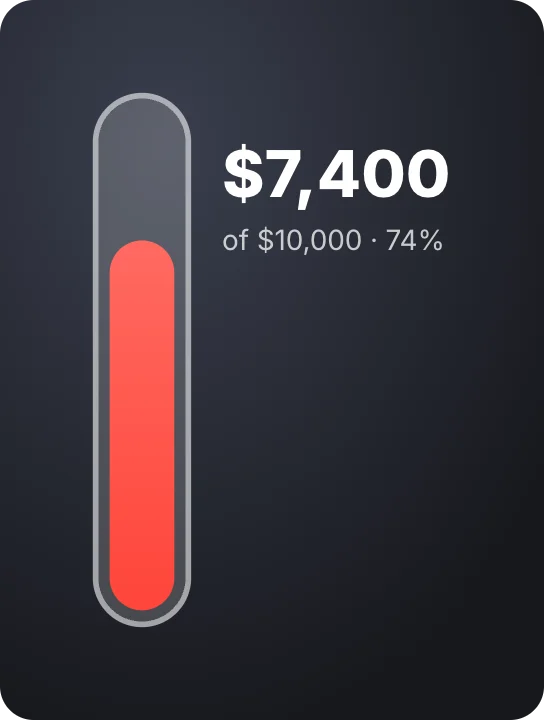 Goal thermometerData & stats · transparent
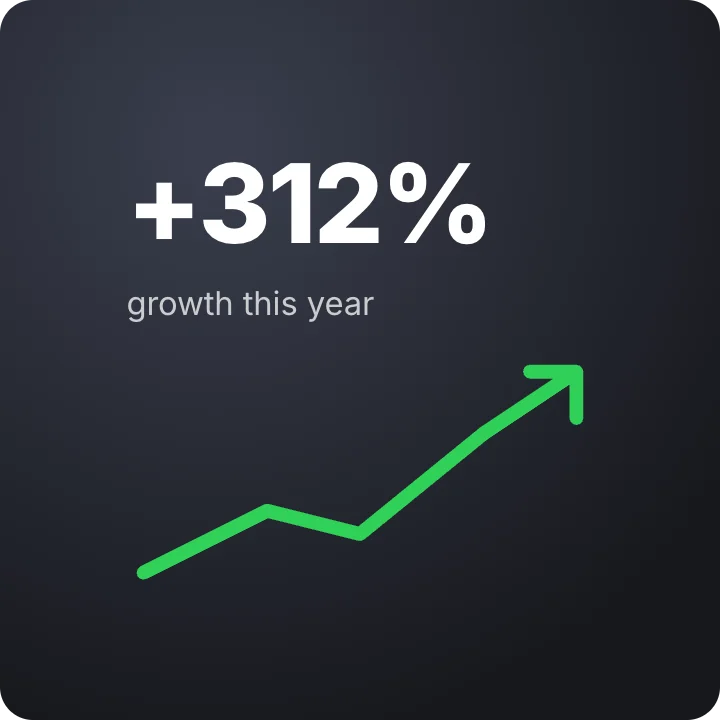 Growth arrowData & stats · transparent
 StopwatchData & stats · transparent
 Analog clockData & stats · transparent
 Loading spinnerData & stats · transparent
 Audio barsData & stats · transparent
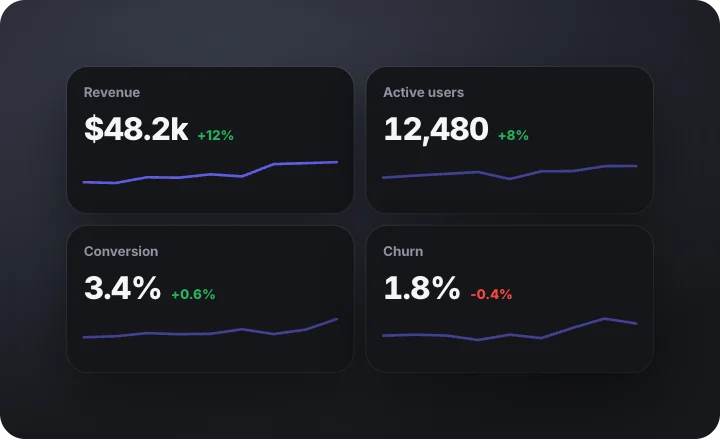 KPI tiles with sparklinesData & stats · transparent
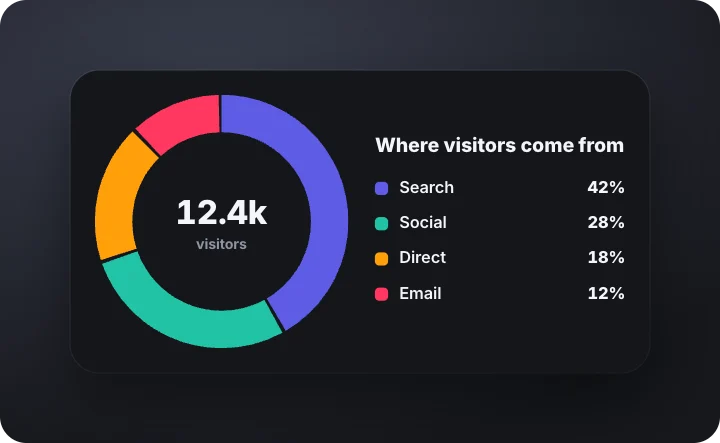 Donut chart with legendData & stats · transparent
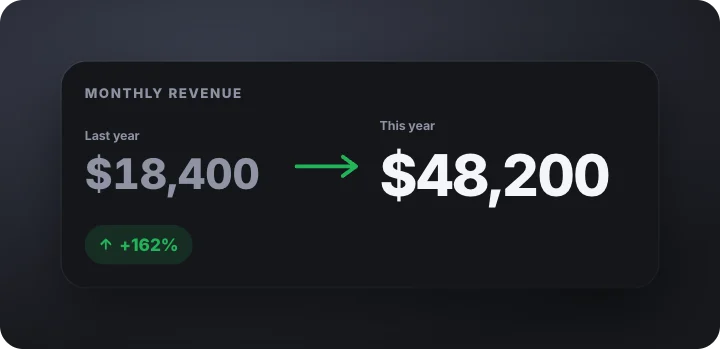 Before and after numberData & stats · transparent
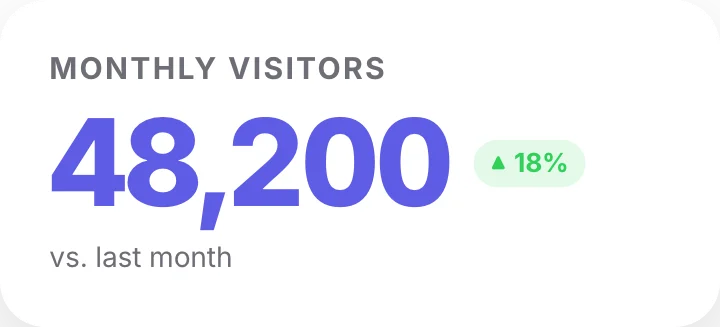 Statistic – basicData & stats
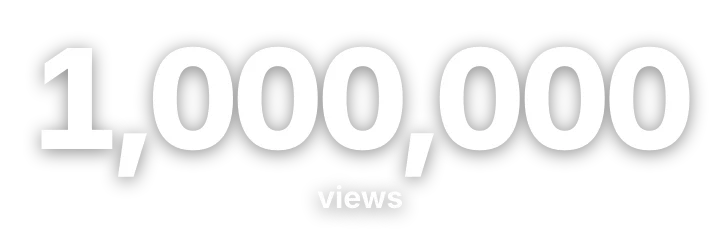 CounterData & stats · transparent
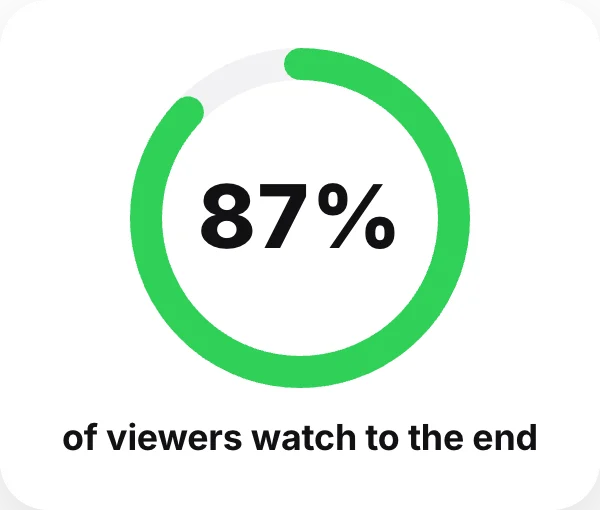 Percentage ringData & stats
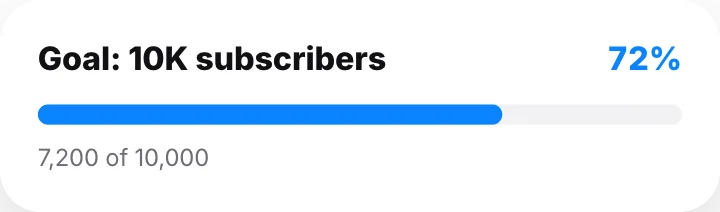 Progress barData & stats
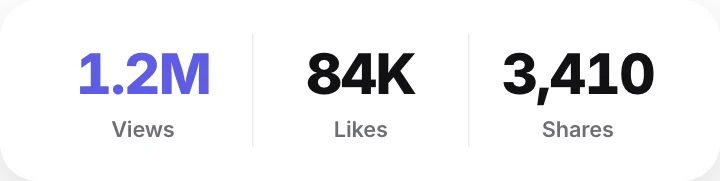 Stats rowData & stats
 Countdown timerData & stats · transparent
 Star ratingData & stats
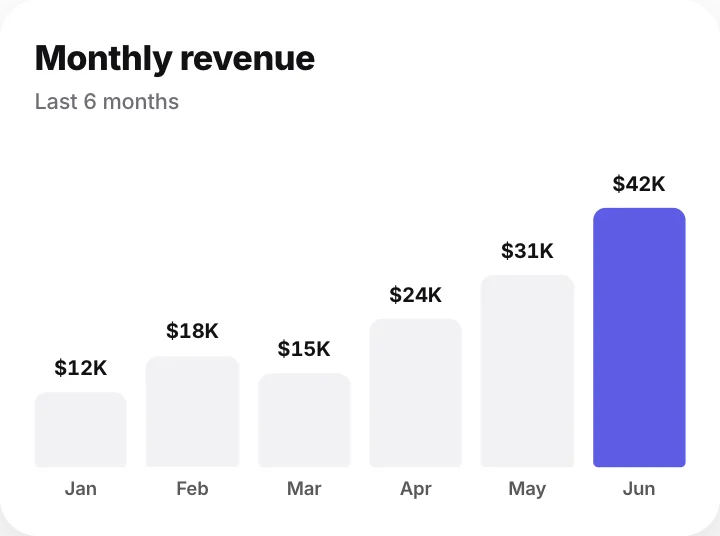 Bar chartData & stats
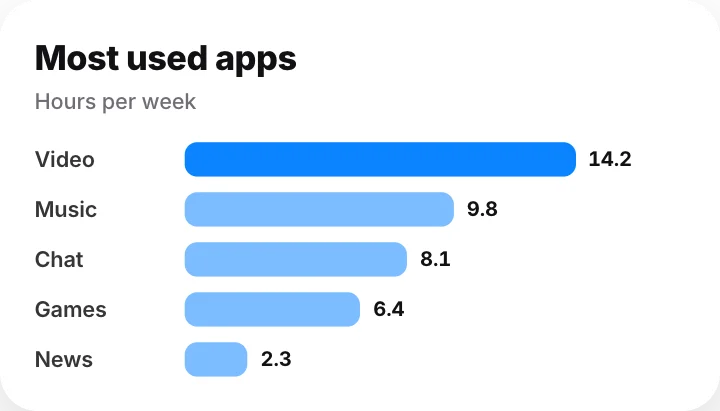 Horizontal bar chartData & stats
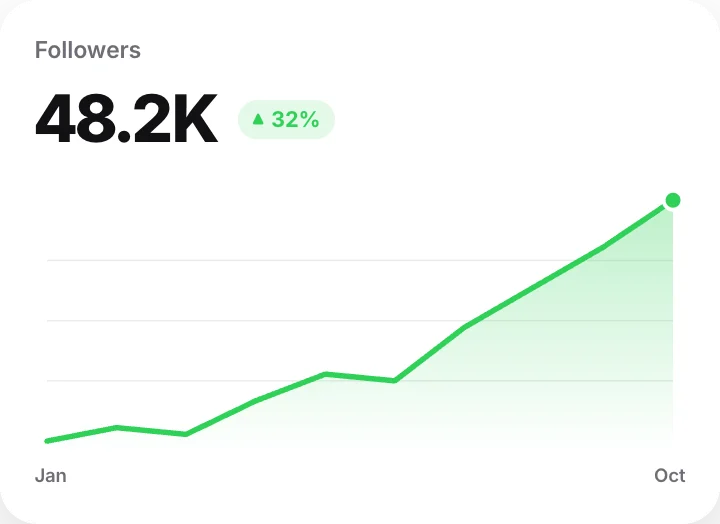 Line chart with totalData & stats
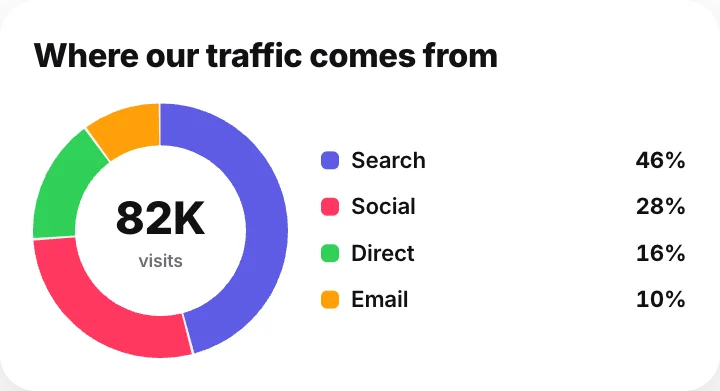 Donut chartData & stats
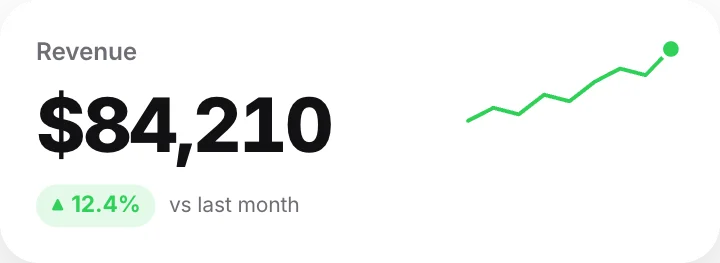 Stat with trend lineData & stats
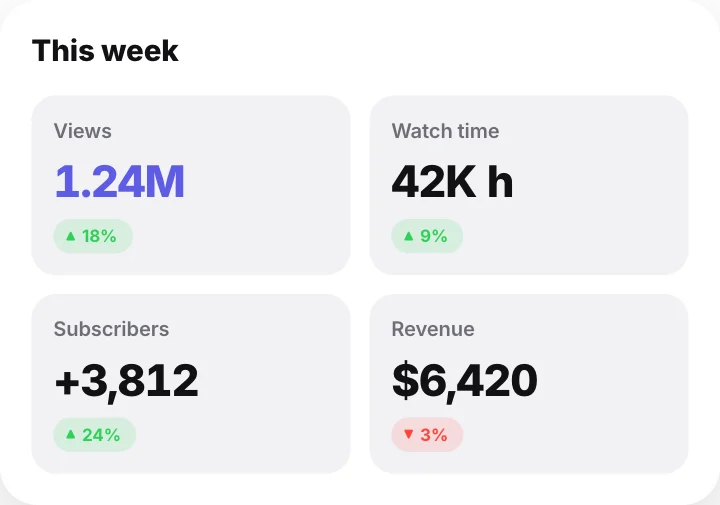 KPI gridData & stats
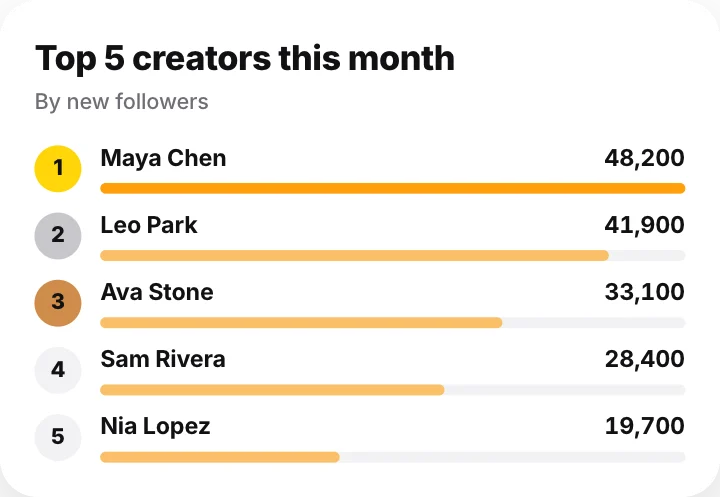 Top 5 rankingData & stats
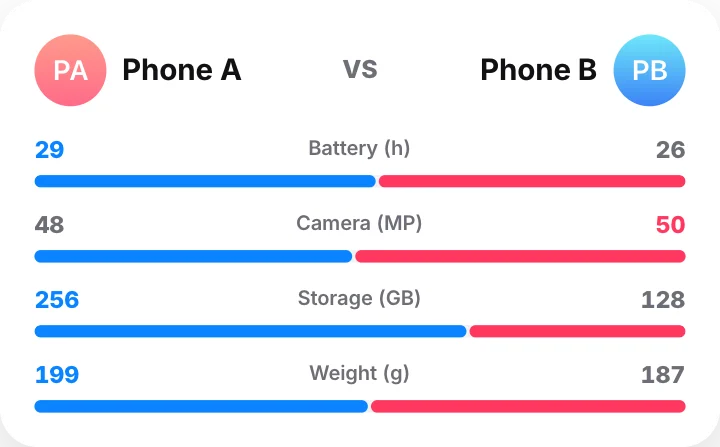 Versus statsData & stats
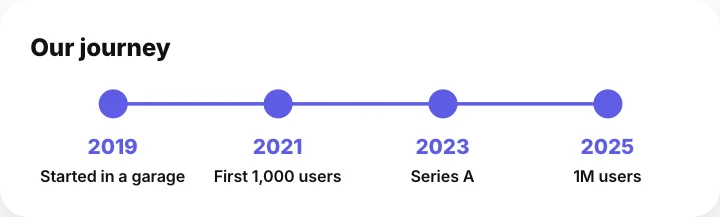 Timeline – horizontalData & stats
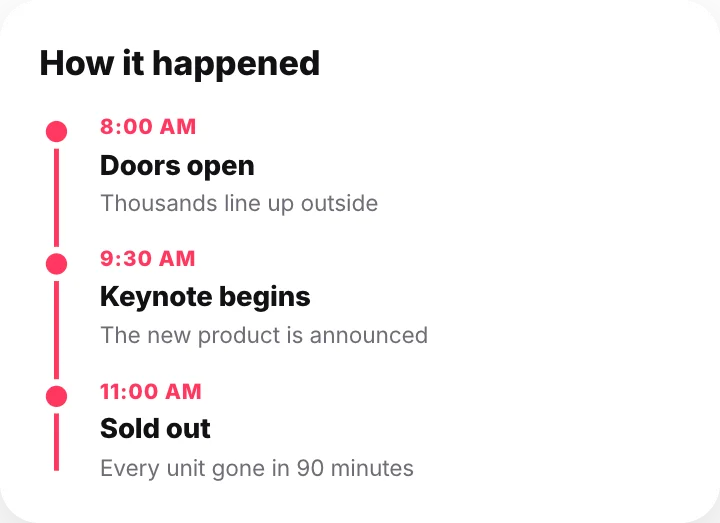 Timeline – verticalData & stats
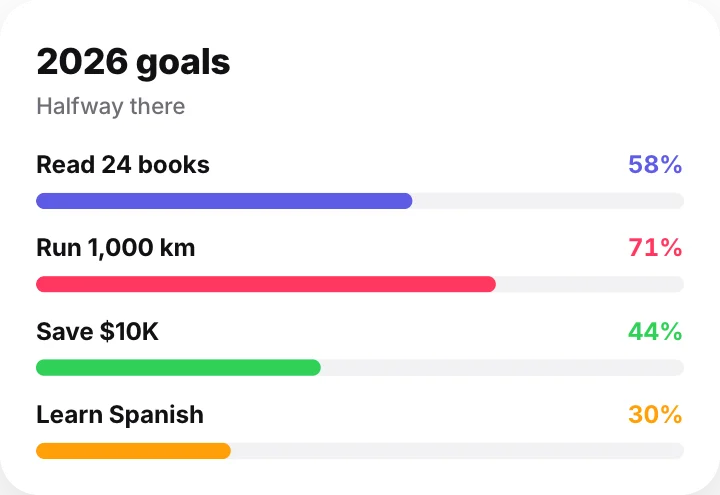 Progress bars – multipleData & stats
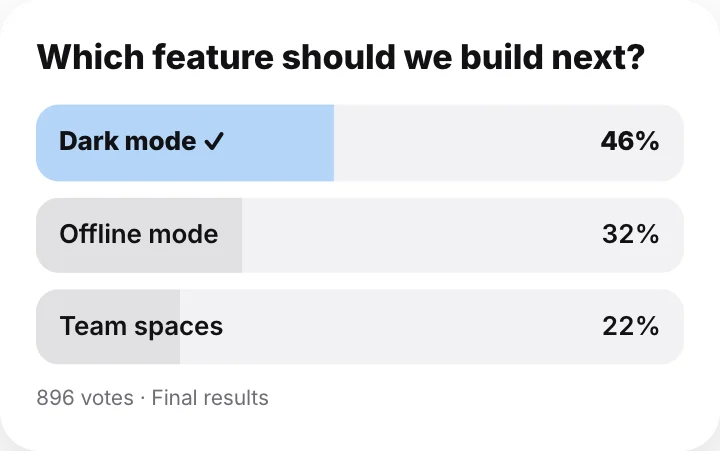 Poll resultsData & stats
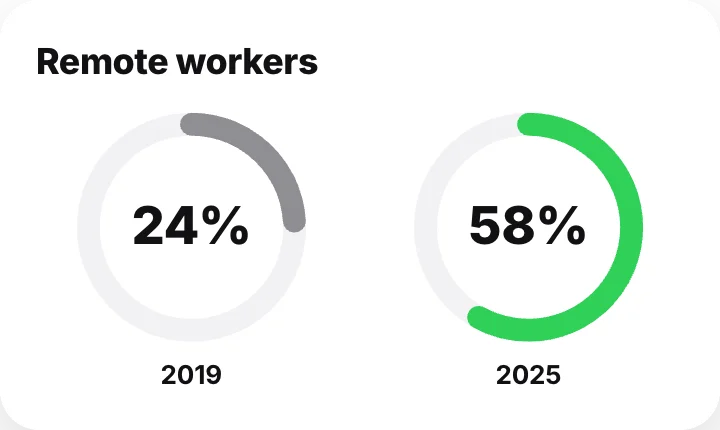 Percentage comparisonData & stats
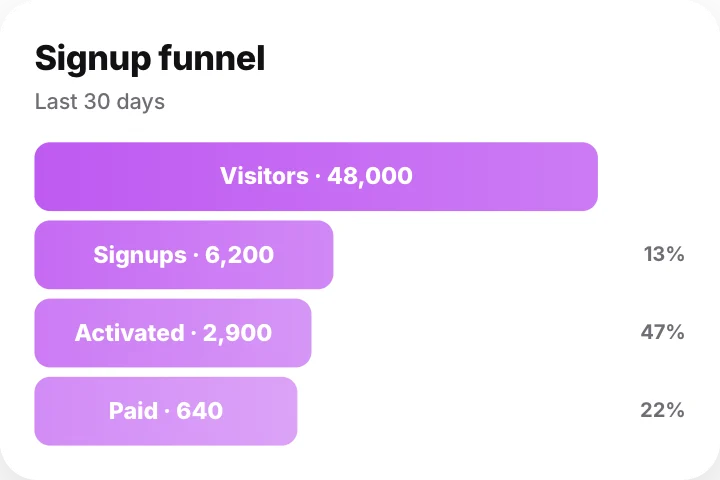 Funnel chartData & stats
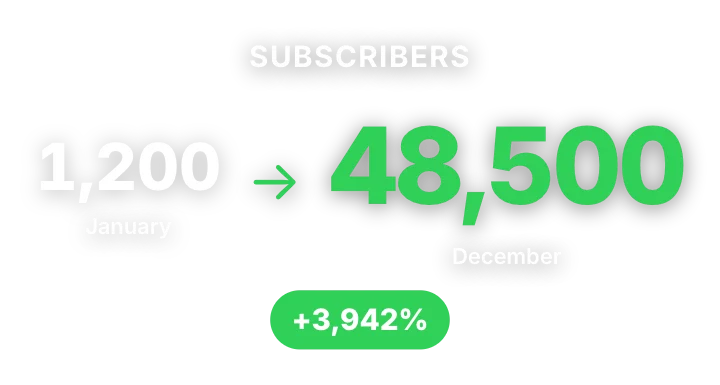 Growth counterData & stats · transparent
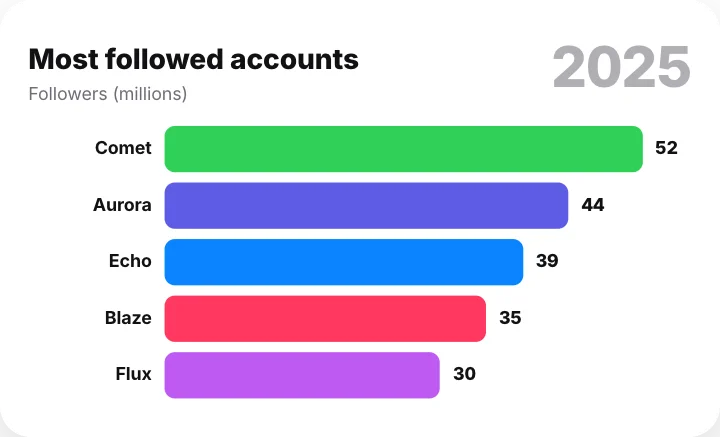 Bar chart raceData & stats
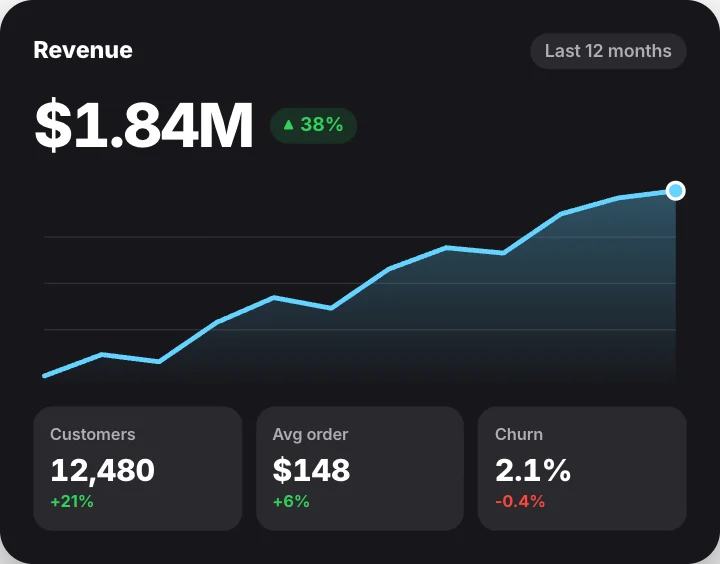 Analytics dashboardData & stats
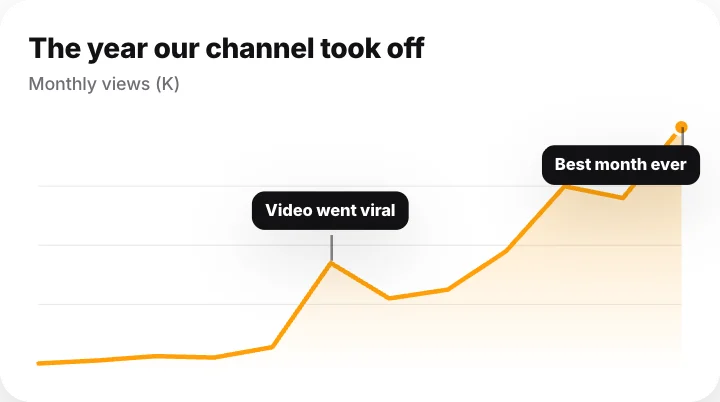 Annotated line chartData & stats
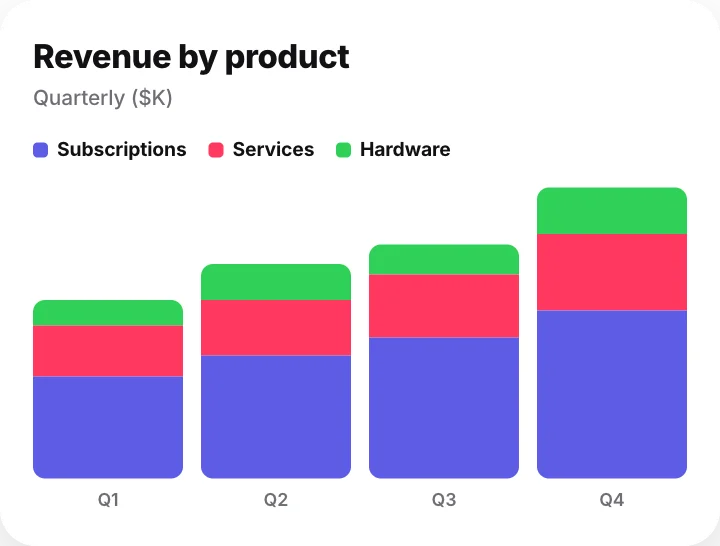 Stacked bar chartData & stats
 Comparison tableData & stats
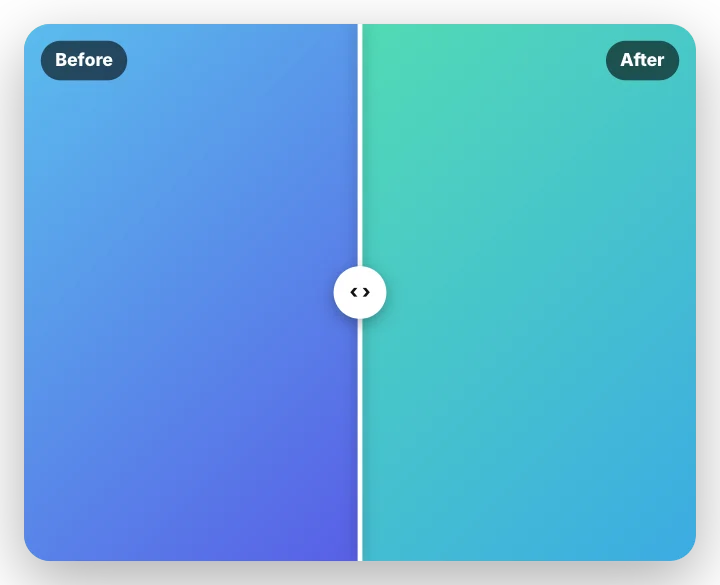 Before / after sliderData & stats · transparent
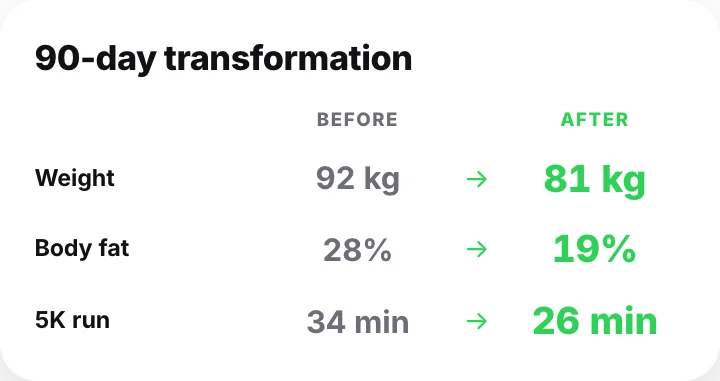 Before / after resultsData & stats
 Cinematic timelineData & stats · transparent
 RoadmapData & stats
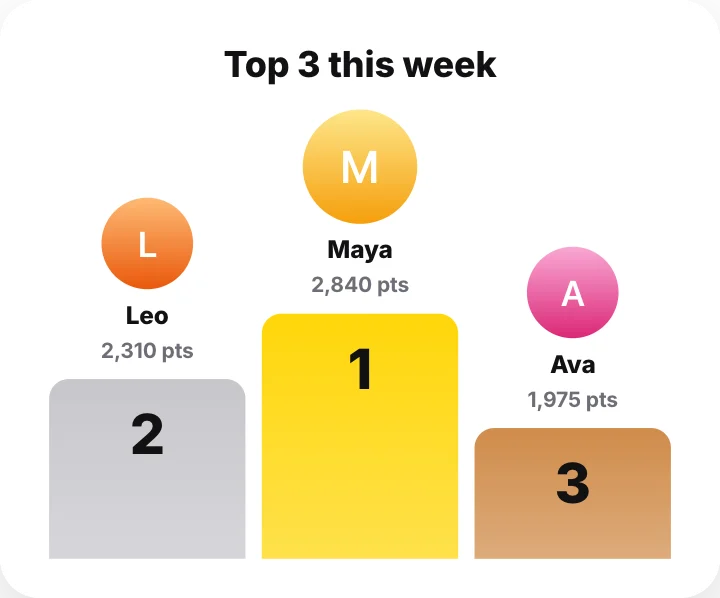 Podium – top 3Data & stats
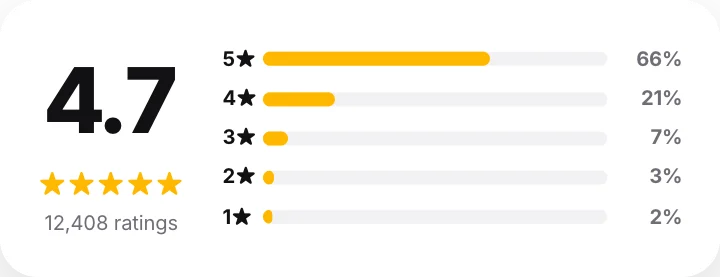 Rating breakdownData & stats
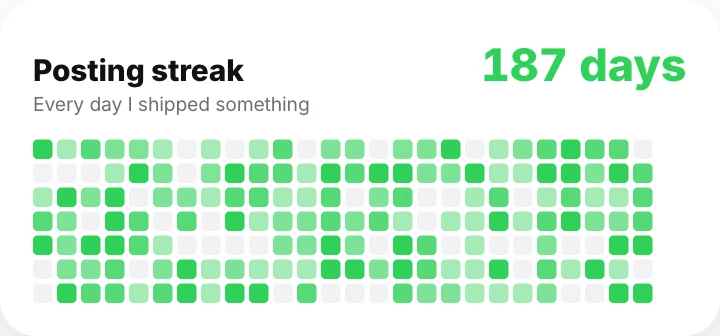 Streak calendarData & stats
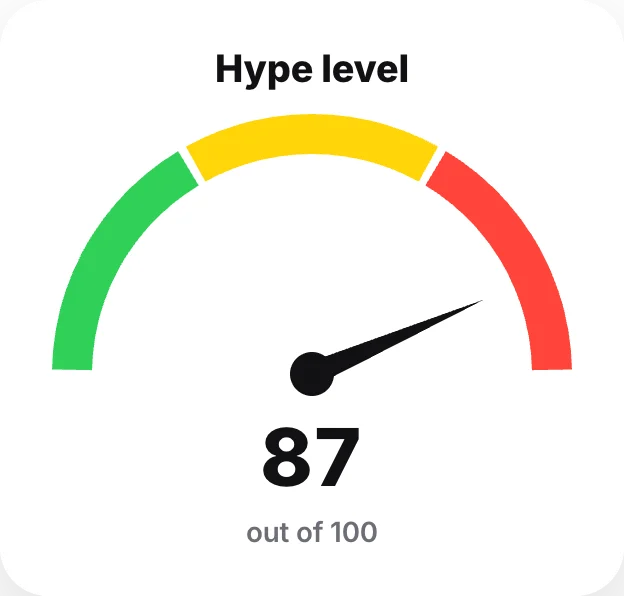 Gauge meterData & stats
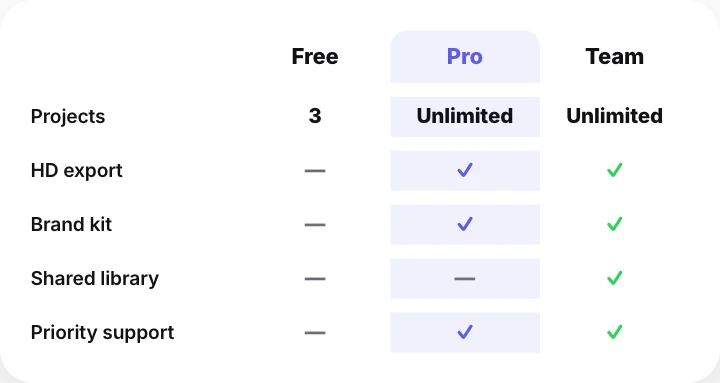 Feature comparison tableData & stats
 Pros and consData & stats
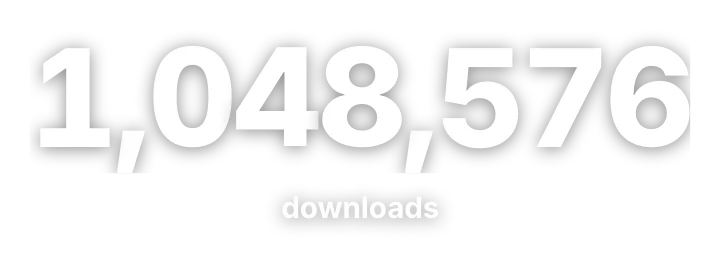 Rolling numberData & stats · transparent
 Stat storyData & stats · transparent
 Waffle chartData & stats
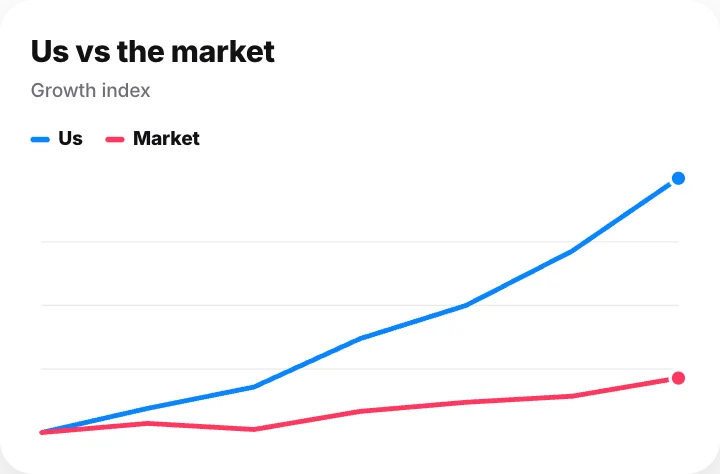 Two-line comparisonData & stats
 People pictogramData & stats
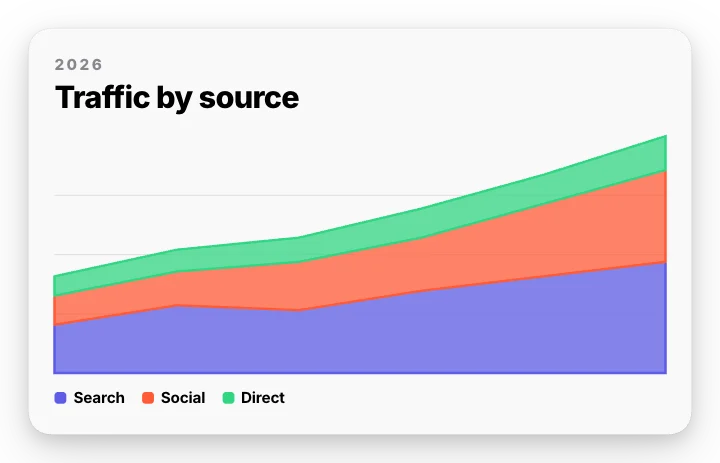 Stacked area chartData & stats
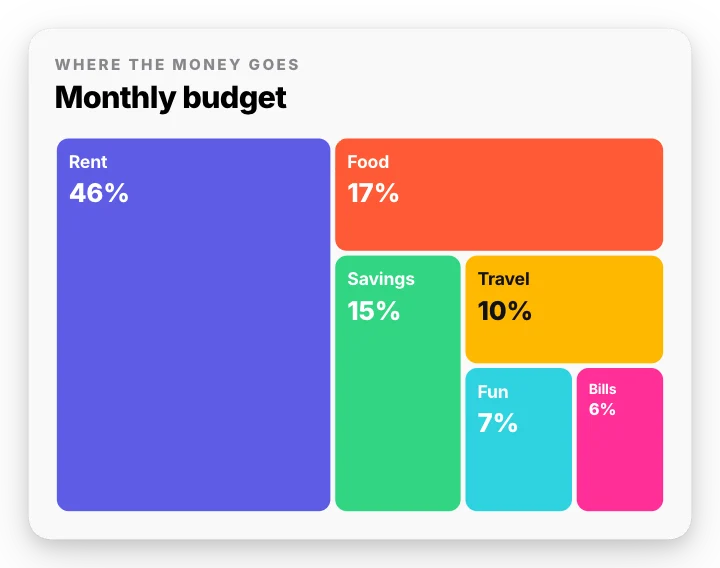 TreemapData & stats
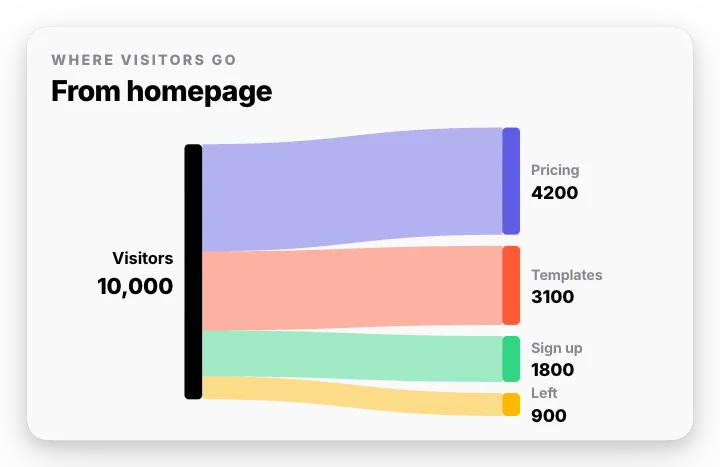 Sankey flow chartData & stats
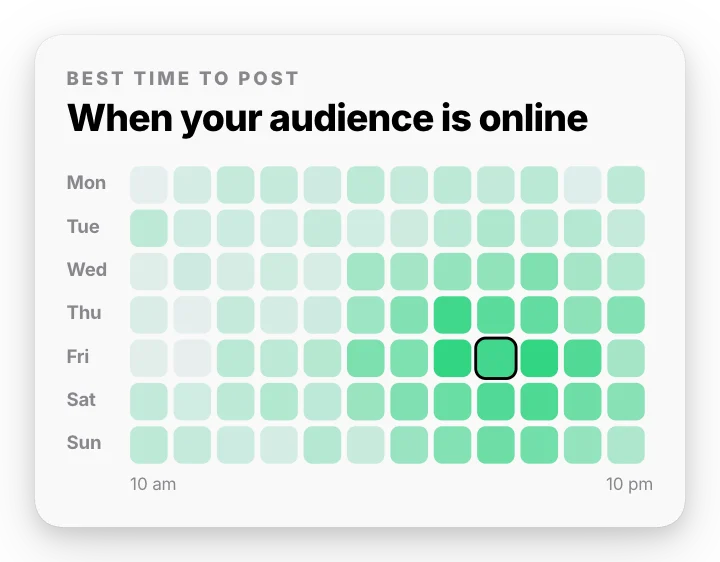 Best time to post heatmapData & stats
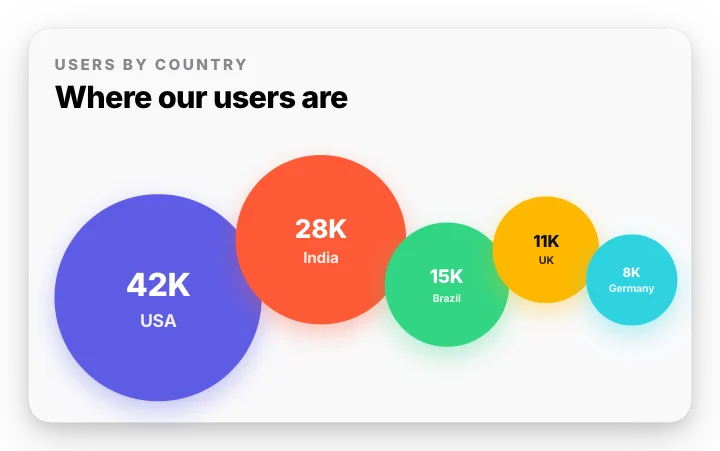 Bubble chartData & stats
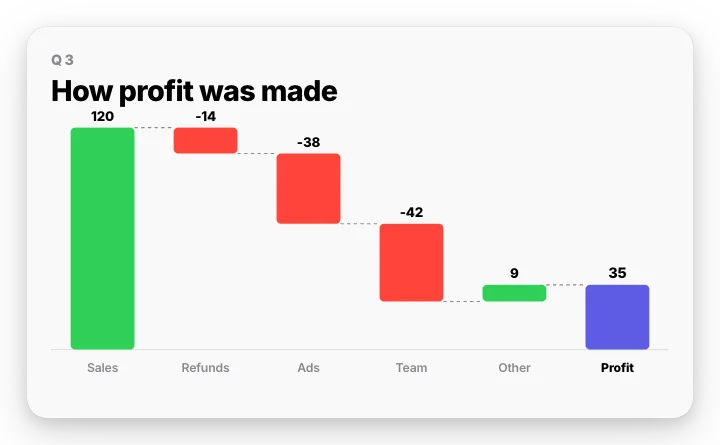 Waterfall chartData & stats
 Venn diagramData & stats
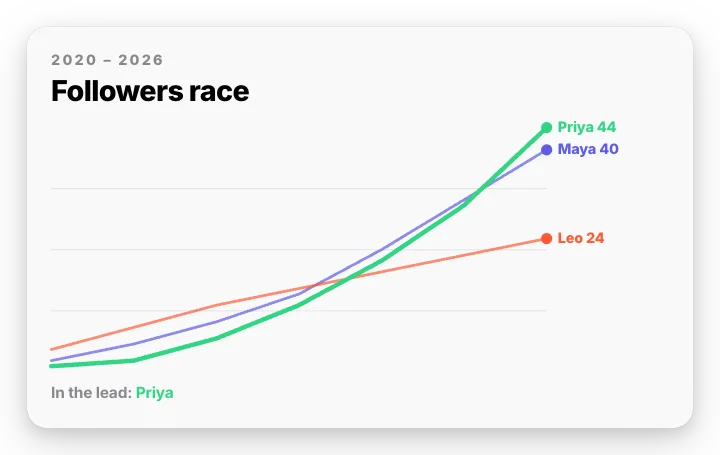 Line race chartData & stats
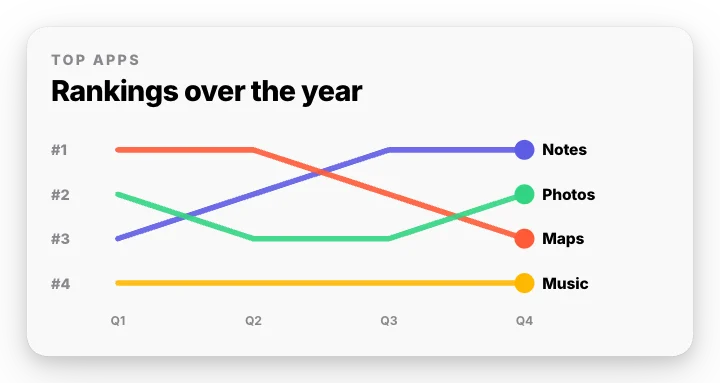 Ranking bump chartData & stats
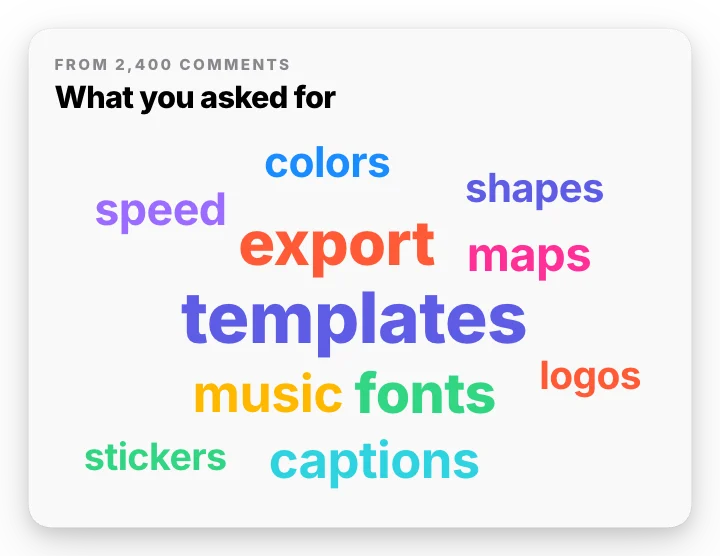 Word cloudData & stats
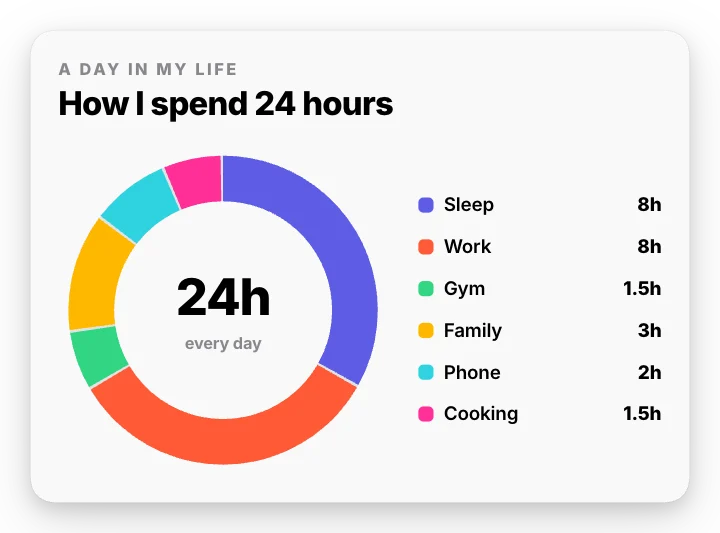 24-hour day ringData & stats
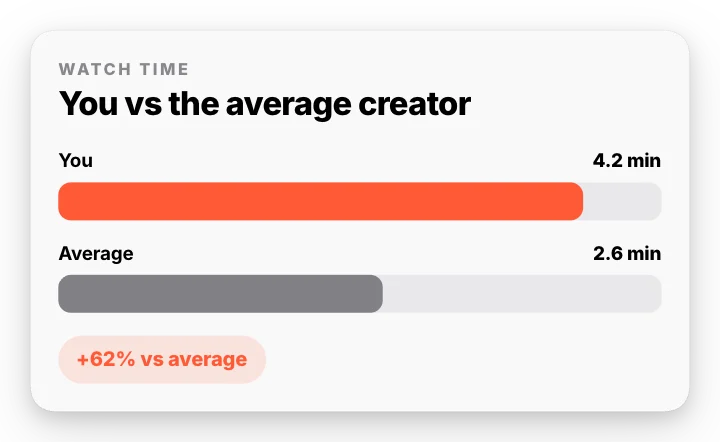 You vs averageData & stats
How to make an animated chart
- Pick a chart. Bar, line, donut and pie charts, bar chart races, rankings, timelines, funnels and KPI grids.
- Type your data. Labels and values, row by row, in the order you want them to appear.
- Export the video. MP4 for social posts and presentations, or a transparent MOV to put over your footage.
Questions
Is this animated chart maker free?
Yes. This section has free templates to use and export, with no card and no watermark. After 3 exports we ask for your email for a free account. Everything is made in your browser, on your own device.
Can I paste my own data?
Yes. Every chart has a list of rows you can edit, add to and reorder. Values can include units such as %, $, k or M and still count up correctly.
Is there a bar chart race?
Yes. The bar chart race template reorders the bars as values change, like the popular "most followed" and "biggest companies" videos.
Can I make infographics for a presentation?
Yes. Export a PNG still for slides, or an MP4 for a video deck. Charts come in light, dark and glass styles.